Why TradingView
You can have the best strategy in the world, but if you cannot read a chart, plan a trade, and check your risk before you click, none of it matters. TradingView is the charting platform almost every serious trader uses, and the good news is that the free plan covers everything a beginner needs. This is a click-by-click walkthrough of the exact tools I use every single day to plan trades.
By the end you will know how to set up your workspace, build a watchlist, mark up a chart, measure risk-to-reward in two clicks, practice on historical data, and let TradingView ping your phone instead of staring at it all day. Prefer to watch? There is a full video walkthrough at the bottom of this guide.
1. Setting Up: Your Free TradingView Account
Start by creating a free account at tradingview.com. You do not need a paid plan to begin. The free tier gives you candlestick charts, a watchlist, the drawing tools, price alerts, and Bar Replay, which is genuinely everything required to plan and practice trades. You will know when you have outgrown it, and that is the day to consider upgrading, not before.
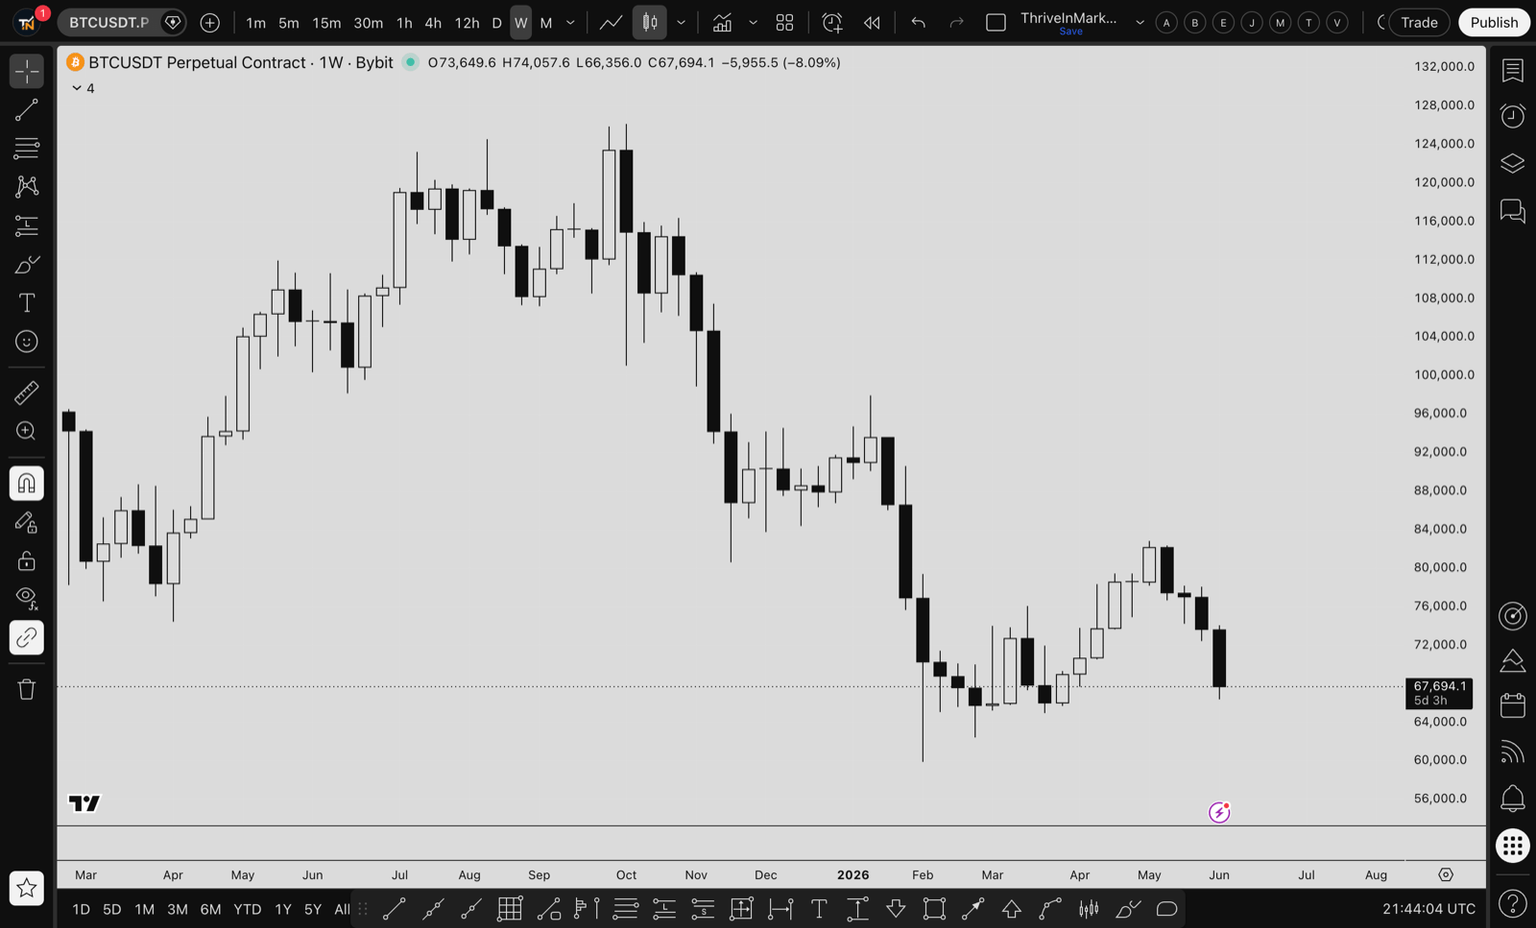
Spend two minutes getting comfortable with the interface. The chart sits in the middle, the toolbar with drawing tools runs down the left side, your watchlist lives on the right, and the timeframe and indicator controls sit along the top. That is the whole map. Everything else is a menu off one of those four areas.
2. Building a Watchlist That Actually Helps
Your watchlist is the list of assets you actually care about, sitting on the right side of the screen. Add the pairs you trade or want to track, whether that is BTC, ETH, gold, an FX pair, or a stock. The point is to stop hunting for the same symbols every time you open the platform and to see your whole universe at a glance, including the live price and the percentage change on the day.
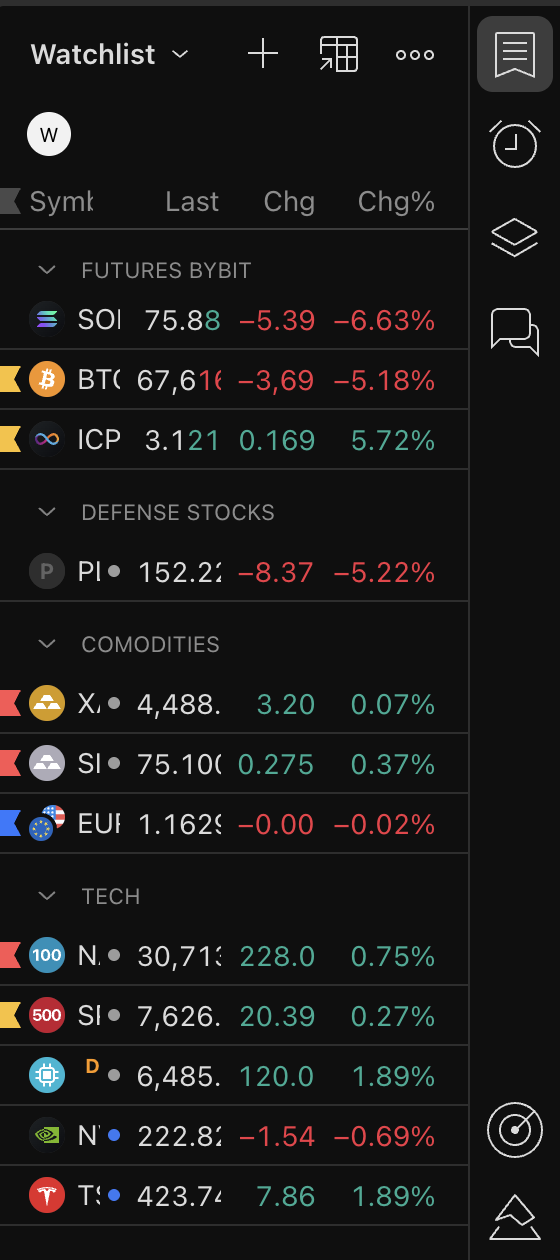
Keep it tight. A watchlist of 100 symbols is noise. A focused list of the handful of assets you genuinely follow is a tool. You can group and organise lists later, but on day one just add the five to ten things you watch.
3. Drawing Tools: Trend Lines, Fibs, and Boxes
The drawing tools on the left toolbar are how you turn a blank chart into a plan. You do not need all of them. You need a handful, used well.
The trend line connects highs or lows to show you the direction and slope of a move. The horizontal line marks a key level, support or resistance, that price keeps reacting to. Fibonacci retracement drags from a swing low to a swing high to show where price is likely to pull back to before continuing. The rectangle or box highlights a zone, like a supply or demand area, rather than a single line. Turn on the magnet so your lines snap cleanly to the exact candle highs and lows instead of landing slightly off. And learn how to hide and delete your drawings so your chart does not turn into spaghetti.
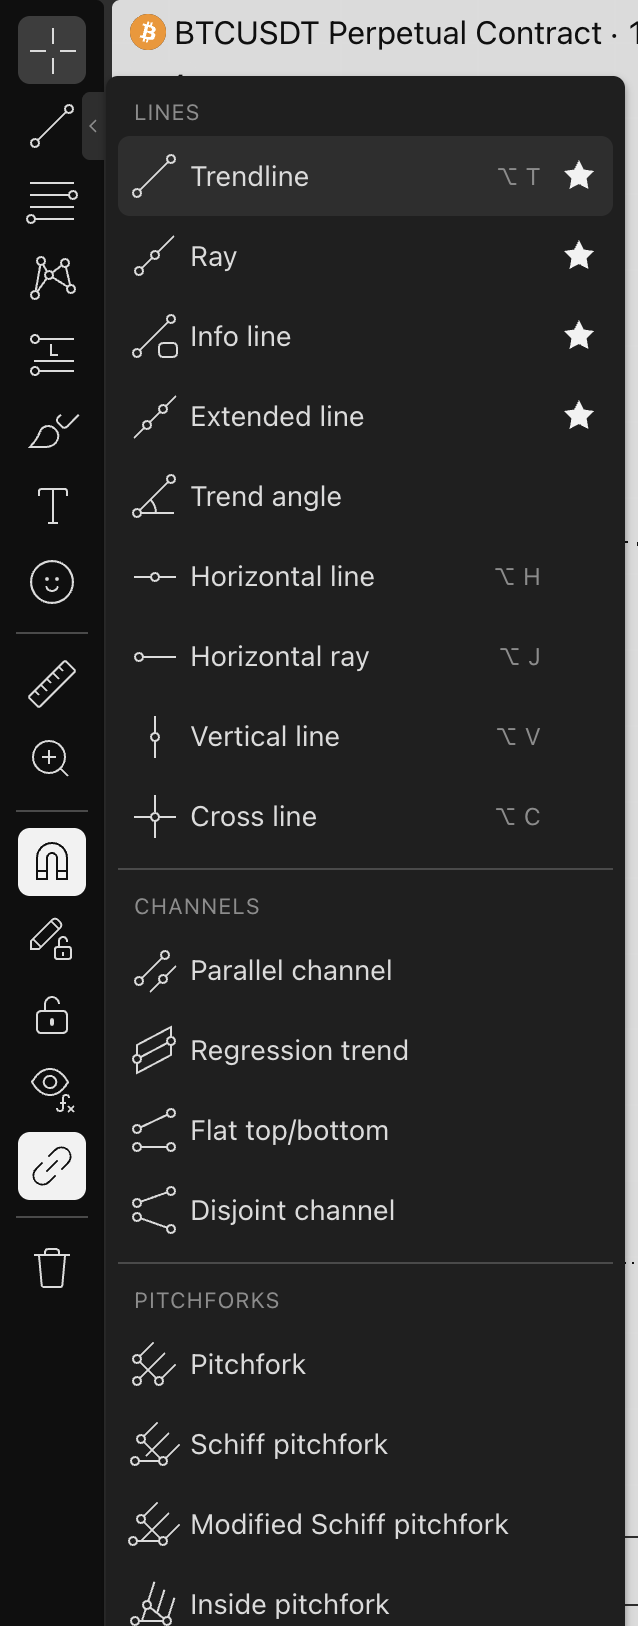
- Trend line -- direction and slope of the move
- Horizontal line -- the support and resistance levels price keeps respecting
- Fibonacci retracement -- where a pullback is likely to find its floor
- Rectangle / box -- mark a zone, not just a line
- Magnet on -- snap to exact candle highs and lows
- Hide and delete -- keep the chart clean and readable
4. The Long/Short Position Tool (The One You Will Use Most)
If you take one thing from this lesson, make it this. The Long Position and Short Position tools draw your entry, your stop loss, and your target straight onto the chart, and they calculate your risk-to-reward ratio automatically. You drag the entry, drag the stop to where you would be wrong, drag the target to where you expect price to go, and TradingView shows you the R/R instantly.
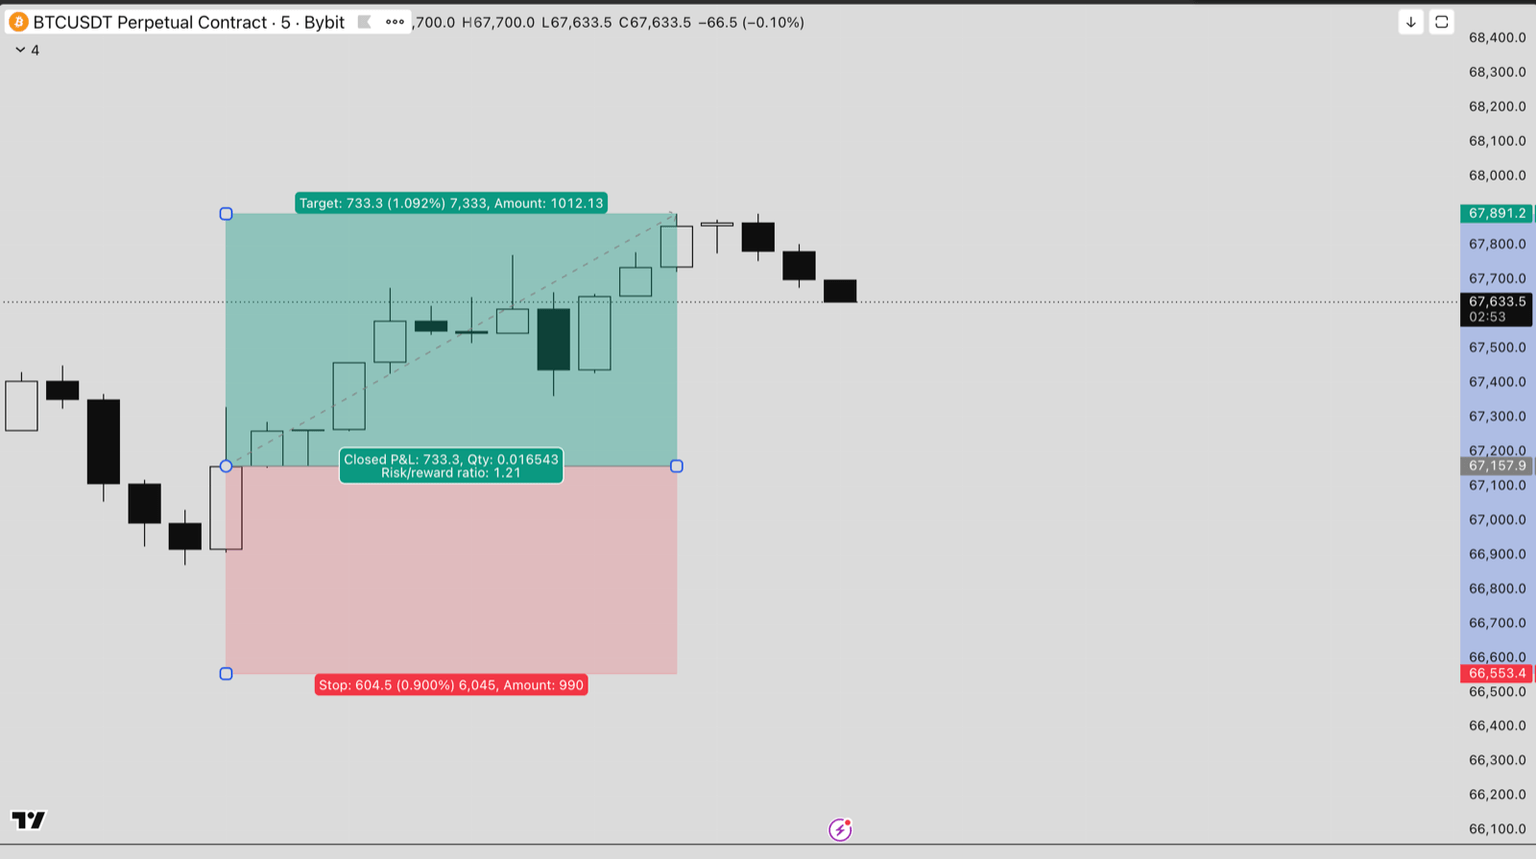
The rule is simple: aim for at least 1:2 risk-to-reward before you commit real money. That means you are risking one to make two. If the math does not work, the setup does not work, and you walk away. This single tool, used before every trade, will do more for your account than any indicator ever will.
- Risk-to-reward, calculated for you -- entry, stop, and target in three drags
- Minimum 1:2 R/R -- risk one to make two, or skip the trade
- Plan before you click -- if the math does not work, the setup does not work
5. Indicators: Less Is More
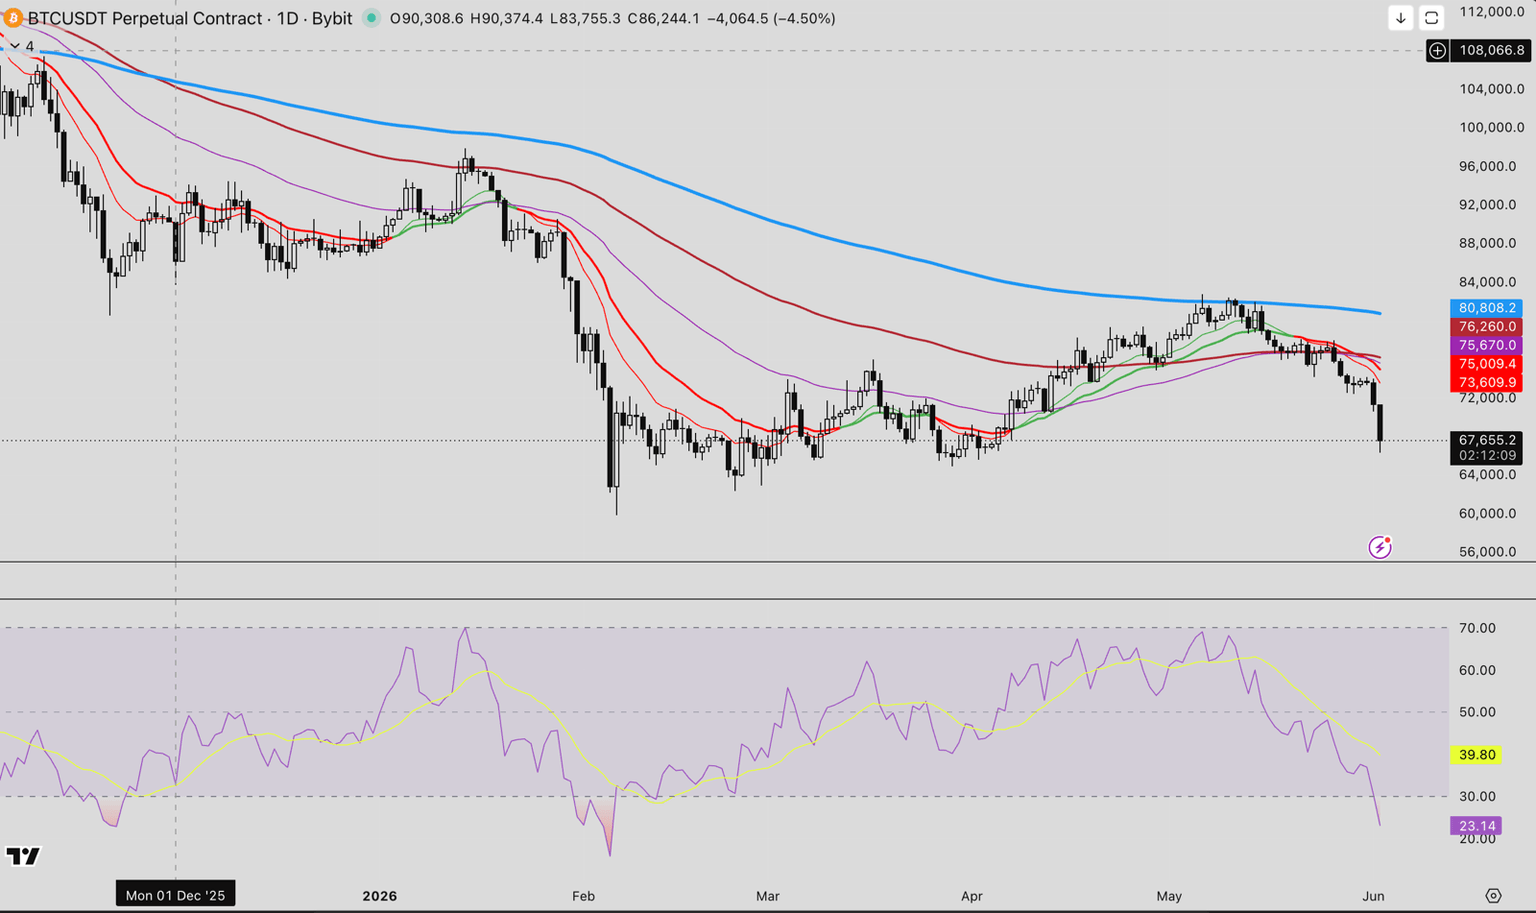
The free plan lets you run an indicator on your chart, and the temptation as a beginner is to stack ten of them until the screen looks like a Christmas tree. Resist it. Most indicators just repackage price and volume, which are already on your chart. A simple moving average to gauge trend, and maybe an RSI for momentum, is plenty to start. Add complexity only when you understand exactly what a tool is telling you and why. Everything else is noise that slows down your decision.
6. Bar Replay: Free Backtesting and Pattern Practice
Bar Replay is the most underused feature on TradingView, and it is free. It lets you rewind the chart to any point in history and play it forward candle by candle. You pause at a moment in the past, decide what you think happens next, then play it forward to see if you were right.
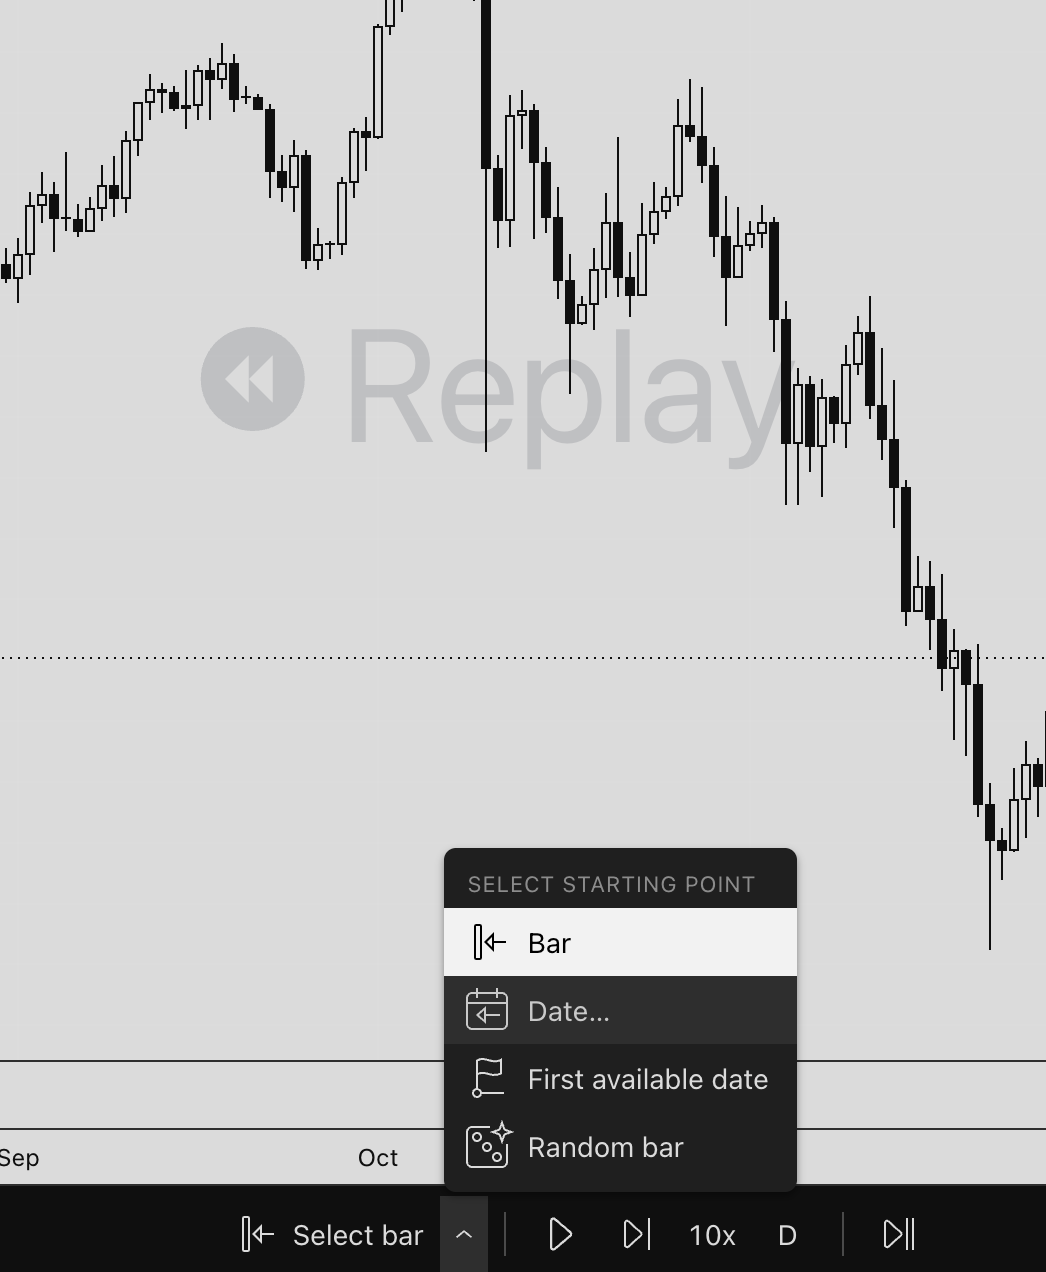
This is pattern-recognition training without risking a cent. Twenty minutes a day in Bar Replay builds the instinct that otherwise costs people real money to develop. You can test a setup across dozens of historical examples in an afternoon -- the kind of structured, repeatable practice that separates traders who actually improve from those who just gamble.
7. Price Alerts: Stop Being a Screen Zombie
You do not need to watch the screen all day, and you should not. Set a price alert on the level you care about, walk away, and let TradingView ping your phone when it triggers. Right-click the price, set the alert, done.
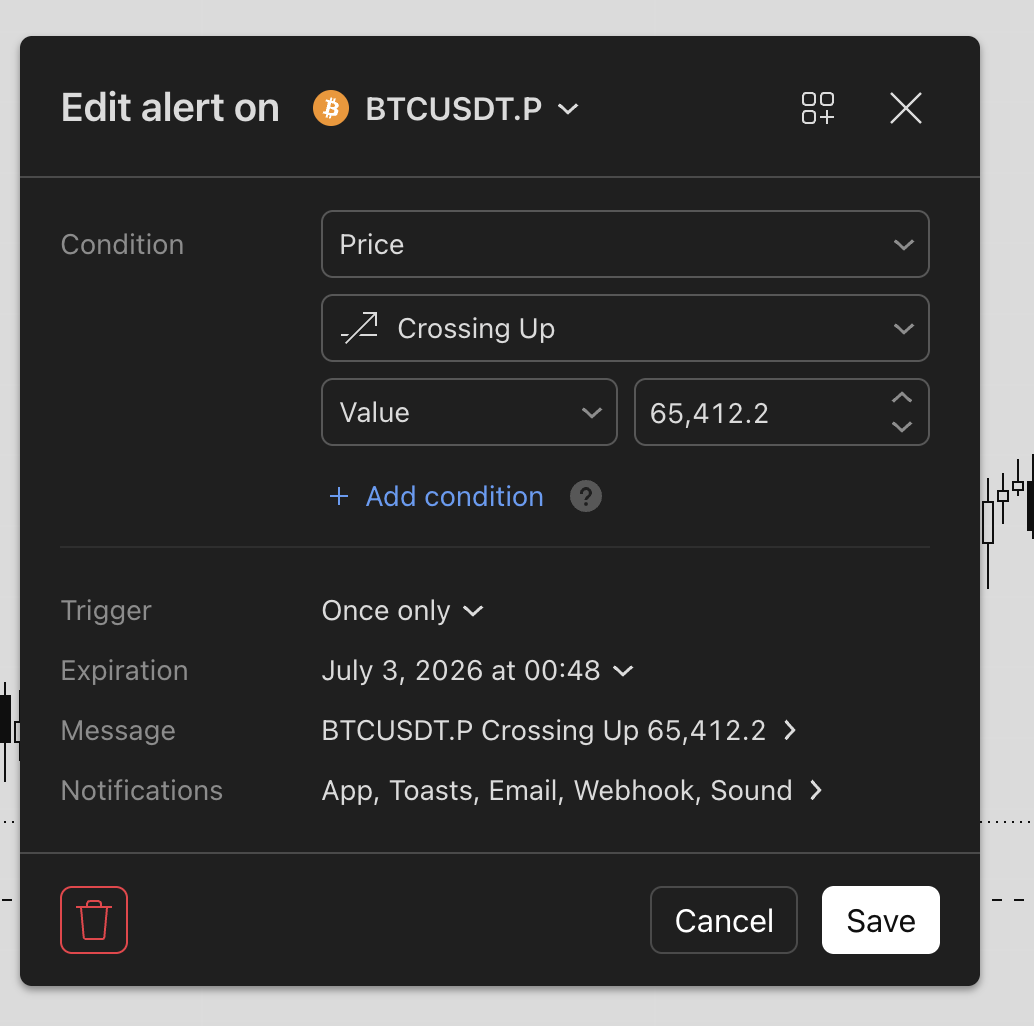
What most beginners miss is that alerts work on indicators too, not just price. You can set an alert for RSI crossing below 30 on the 15-minute chart, for example, or for price closing above a moving average. Define your levels, set your alerts, and go live your life. The market will tell you when it needs you.
8. Timeframes, Scale, and Volume: Context Before Conviction
Always zoom out before you zoom in. A setup that looks great on the 5-minute chart can be sitting right under a massive resistance level that only shows up on the daily. Check the higher timeframe first for context, then drop down to your trading timeframe to time the entry. Context first, always.
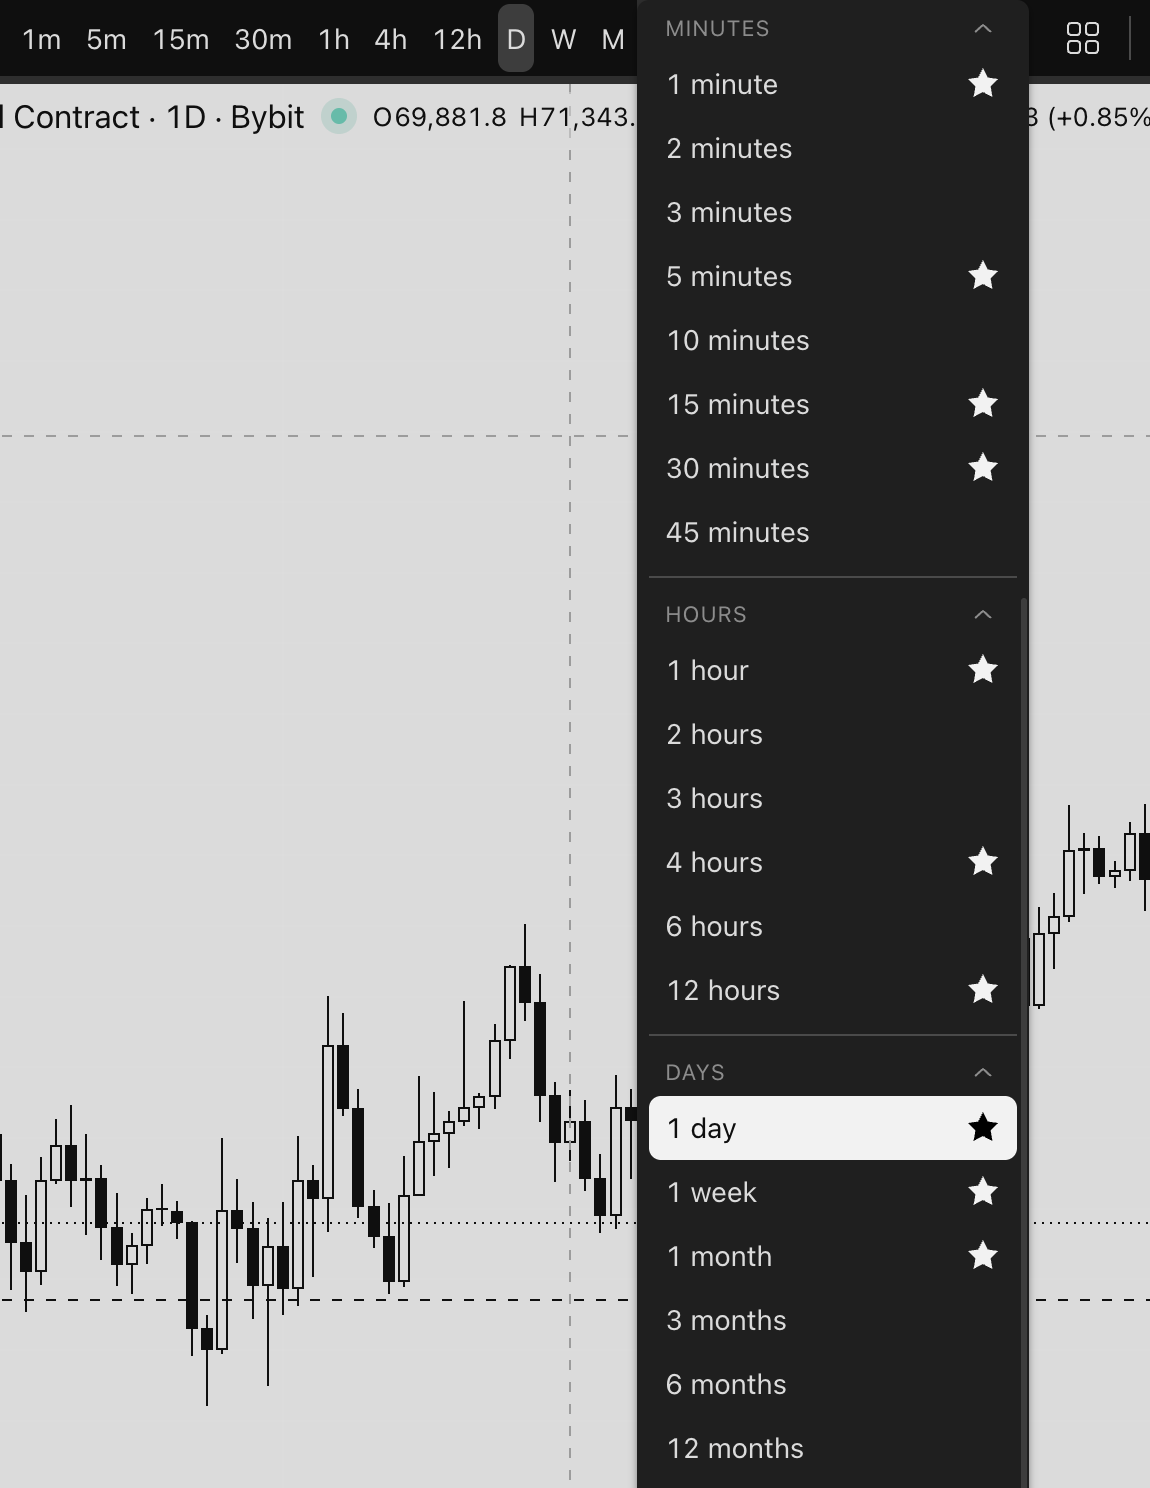
Use the volume at the bottom of the chart as your conviction check. A breakout on heavy volume means real participation. A breakout on thin volume often fails. And learn the difference between the auto scale and a locked scale so your chart does not keep squashing or stretching as price moves. Small things, but they keep you reading the chart honestly.
- Watchlist -- a tight list of the assets you actually trade
- Drawing tools -- trend lines, horizontals, Fibs, boxes, magnet on
- Position tool -- 1:2 risk-to-reward minimum, checked before every entry
- One or two indicators -- moving average and RSI, no Christmas tree
- Bar Replay -- free pattern practice, 20 minutes a day
- Alerts -- on price and indicators, so you can walk away
- Higher timeframe first -- context before conviction, volume confirms
Wrap Up: Plan the Trade, Then Trade the Plan
TradingView is where the plan happens. You build your watchlist, mark your levels, measure your risk-to-reward with the position tool, practice in Bar Replay, and set alerts so the chart comes to you. Master the free plan completely before you ever pay for an upgrade, because almost everything you need is already there.
Once your plan is drawn on the chart, you still need somewhere to execute it. I personally use Bybit for the liquidity, the perpetual futures market, and the order tools. New users get $20 USDT free plus up to $30,000 in rewards through that affiliate link. Disclosure: it is an affiliate link, but I use the platform myself.
Master the free plan, plan every trade before you click, and let the alerts do the watching. That one habit puts you ahead of most beginners.
Watch the Full Walkthrough
Here is the complete screen-share version of everything above, start to finish:
Want to go further? Check out the full free trading course -- everything from order types and exchanges to leverage and risk management, step by step.