Where Prices Sit At The Open
Wednesday May 13 opens with the tape digesting a clean miss on the inflation print. April CPI landed yesterday at 3.8% headline year-over-year against the 3.7% Dow Jones consensus, the hottest annual print since May 2023, with core CPI at 2.8% YoY vs 2.7% expected and the monthly core at +0.4% above the +0.3% call. The S&P 500 absorbed the print and closed at 7,400.96 (-0.16%), well off the intraday lows that ran the index down as much as 1%. The Nasdaq Composite traded down as much as 2% before recovering, with Qualcomm -12% and Intel -9% driving the semis-led rotation out of tech and into financials, healthcare, consumer staples and energy.
Going into Wednesday's April Producer Price Index at 12:30 UTC (08:30 ET), Bitcoin trades $80,957 (+0.6% 24h) on the live TradingView tape, Ethereum holds $2,300 flat on the 24-hour, and Gold prints $4,734 (+0.4% 24h) with the daily range spanning $4,676 to $4,773. WTI broke the $100 round number on the CPI release and trades $101.01 Wednesday morning, the first sustained print above $100 since the late-April Iran-Hormuz spike. The December Fed rate strip has rebuilt to a roughly 30% chance of a rate hike, the first time hike odds have meaningfully outpriced cuts since the start of the Powell second term.
- BTC $80,957 (+0.6% 24h), ETH $2,300 (flat 24h), Gold $4,734 (+0.4% 24h)
- WTI broke $100 to $101.01 on the hot CPI print and rebuilt Iran-Hormuz premium
- S&P 500 closed 7,400.96 (-0.16%), well off intraday lows; Nasdaq absorbed -2% intraday before recovery
- April PPI prints 12:30 UTC Wednesday; December Fed hike odds rebuilt to roughly 30%
The Hot CPI Print Decoded: What 3.8% / 2.8% Really Means
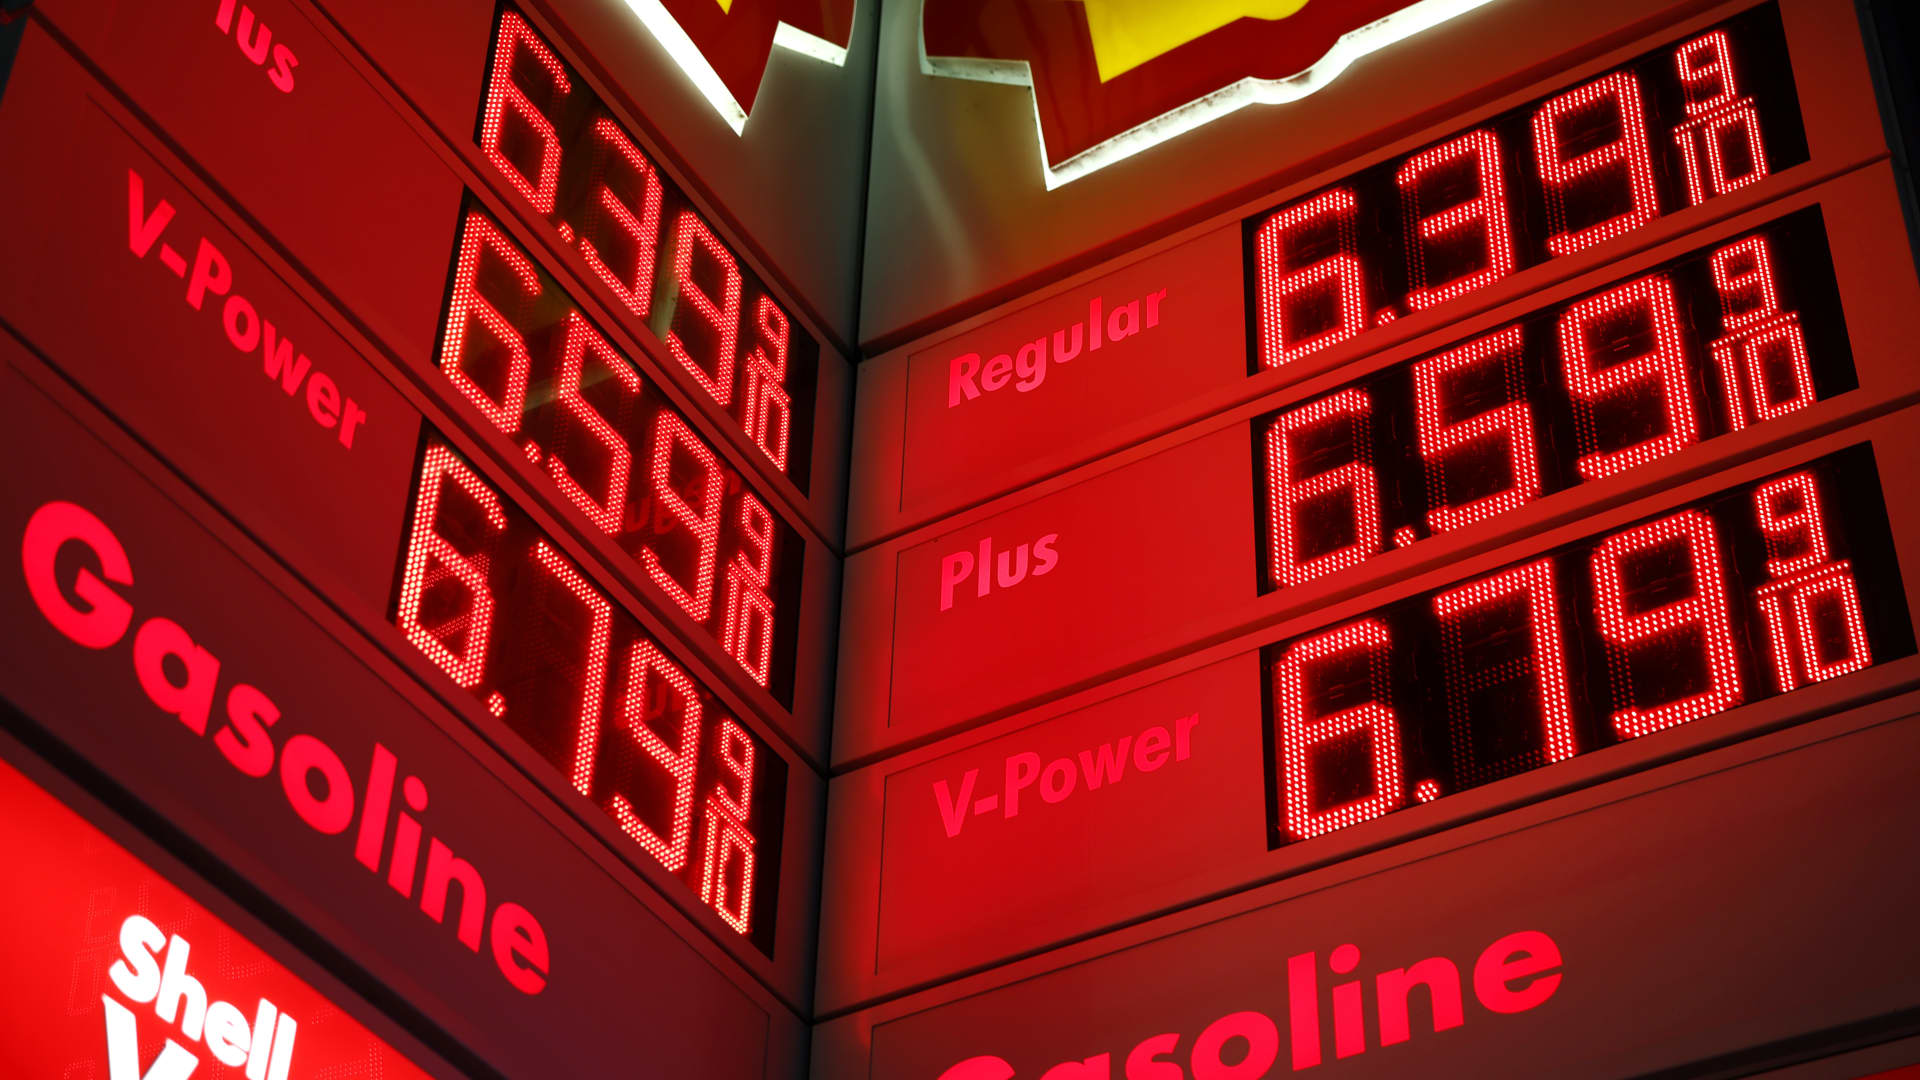
Per the CNBC release breakdown, the April CPI rose 0.6% month-over-month on a seasonally adjusted basis putting the one-year pace at 3.8%, up from 3.3% in March. Core CPI, which strips out food and energy, rose 0.4% on the month and 2.8% on the year. Both annual readings beat the consensus calls and both are the hottest readings since the May 2023 peak of the post-pandemic disinflation cycle. The clearest read is in the breakdown: energy prices rose 3.8% month-over-month and contributed more than 40% of the headline gain, with the gasoline index up 28.4% on a year-over-year basis. Food prices added another 0.5% to the monthly headline. The real average hourly earnings line dropped -0.5% on the month and -0.3% on the year, eroding household purchasing power for a second consecutive print.
The core print is what matters more for the FOMC trajectory. A 2.7% core in line with consensus would have preserved the September cut path; the 2.8% surprise tells the Fed that the Iran-Hormuz shock is no longer purely an energy story. Per the CBS News release recap, services inflation, shelter and the trimmed-mean basket all firmed in the month, evidence that the gasoline pulse has bled into the sticky basket through input costs and transport margins. The mechanical chain is the one the FOMC has been calling out since the March SEP revision: a sustained $100 WTI feeds into the May headline through retail gasoline, and the diesel pass-through feeds into goods CPI on a six-to-eight week lag.
- Headline CPI 3.8% YoY (vs 3.7% consensus), +0.6% MoM in line; hottest annual print since May 2023
- Core CPI 2.8% YoY (vs 2.7% consensus), +0.4% MoM (vs +0.3% consensus); core surprise is the structural shift
- Energy +3.8% MoM, gasoline +28.4% YoY; energy contributed more than 40% of the headline gain
- Real average hourly earnings -0.5% MoM, -0.3% YoY; household purchasing power eroding
- The core 2.8% surprise tells the FOMC the Iran shock has broadened into the sticky basket, invalidating the September cut path
PPI Day Is The Confirmation Layer
The April Producer Price Index lands Wednesday at 12:30 UTC (08:30 ET), and it is the cleanest confirmation or rejection of the CPI signal on the tape this week. PPI measures price pressure at the wholesale level and historically leads CPI by one to two months on the goods side. March PPI rose 0.5% on the month with the headline at 4.0% YoY, with final demand goods +1.6% driving the index. The April call sits at +0.4% MoM headline and a roughly 4.2% YoY headline; core PPI is expected around +0.3% MoM and 3.5% YoY.
The asymmetry is the same as the CPI but in reverse. A soft PPI (below +0.3% MoM headline and 3.9% YoY) would tell the tape that the April CPI was the energy spike already known and that producer margins are absorbing the shock rather than passing it through. That partially rehabilitates the September cut. A hot PPI (above +0.5% MoM and 4.3% YoY) confirms the CPI signal, locks in the December hike-skew, and feeds straight into the dollar through the rate-strip channel. The Wednesday session's risk path is squarely contingent on which side of the consensus the PPI lands.
- April PPI lands 12:30 UTC Wednesday; consensus +0.4% MoM headline, 4.2% YoY headline
- March PPI base: +0.5% MoM headline, 4.0% YoY, with final demand goods +1.6%
- Soft PPI (below +0.3% MoM) rehabilitates the September cut and is risk-on for duration and tech
- Hot PPI (above +0.5% MoM) confirms CPI, locks in December hike-skew, firms the dollar
- PPI is the cleanest read on whether the Iran-Hormuz shock is sticking in producer margins
April CPI 3.8% headline / 2.8% core marks the hottest annual inflation read since May 2023. Energy contributed more than 40% of the headline gain; real wages slipped for a second consecutive month.
Equities: Records Slip As Rotation Cuts Tech Hard
The S&P 500's 7,400.96 close (-0.16%) dropped the index from Monday's all-time high of 7,412.84 but held the structural 7,400 shelf that has been the cycle support since the late-April records first cleared the level. The intraday tape was a textbook hot-CPI sequence: futures dropped 1% on the 08:30 ET release, the cash open ran the index to the 7,330 area, and a sustained bid into the close from financials, energy and the staples baskets recovered roughly three-quarters of the morning loss. The Nasdaq Composite saw the harder rotation: per CNBC's session recap, the index traded down as much as 2% intraday with Qualcomm -12% and Intel -9% as the day's anchor declines. The semis rotation was driven by the same higher-for-longer rate-strip that punished duration in March, with the AI capex names absorbing the brunt of the multiple compression.
The structural read for Wednesday is that the rotation is not a top in the index; it is a top in the chip-led leadership cohort. Financials caught a strong bid on the steeper yield curve, energy ran with WTI through $100, and the consumer staples and healthcare baskets benefited from the defensive rotation. Alibaba and Cisco report earnings Wednesday, the first major data point after the CPI shock for two structurally different exposures: Alibaba reads the China consumer into the Trump-Xi summit, and Cisco reads the enterprise AI networking capex cycle that JPMorgan flagged as a core overweight in its mid-year outlook.
- S&P 500 7,400.96 (-0.16%), off Monday's 7,412.84 record but holding the 7,400 structural shelf
- Nasdaq traded down as much as 2% intraday; Qualcomm -12%, Intel -9% anchored the chip rotation
- Rotation: out of semis and AI capex names, into financials, energy, healthcare, staples
- Bullish trigger for SPX: a soft PPI plus a reclaim of 7,425 reopens 7,500; bearish trigger: a hot PPI plus a break of 7,375 opens the 7,300 shelf retest
- Wednesday earnings: Alibaba (China consumer pre-summit) and Cisco (enterprise AI networking capex)
Oil Breaks $100 As Hormuz Premium Locks In
WTI front-month trades $101.01 Wednesday morning, the first sustained print above the $100 round number since the late-April Iran-Hormuz spike. The intraday Tuesday range printed $98.02 to $102.03, with the cash break above $100 coming on the same 08:30 ET CPI release that pressured the equity tape. The structural read is the one we have been tracking since the Monday morning analysis: Trump rejected Iran's peace response Saturday on Truth Social, Trump said the US-Iran ceasefire is on "massive life support" Tuesday, and the Strait of Hormuz remains effectively closed to the tanker flow that historically clears 20% of seaborne crude.
For Wednesday into the Beijing summit, the WTI structural map sits at $98 as the floor, $100 as the pivot, and $103 to $105 as the next resistance band. The mechanical reflex from $101 into a PPI confirmation puts the $105 line on the table on a 24-hour basis; a Beijing-brokered de-escalation out of the Thursday-Friday Trump-Xi summit pulls WTI back through $95 and unwinds a meaningful piece of the May headline CPI feedthrough. The Iran chapter remains the dominant variable: Iran is China's largest oil customer, which puts Hormuz squarely on the Trump-Xi summit agenda ahead of the bilateral trade chapter, compressing the rare-earth and Boeing-order deliverables that were the original scaffolding of the meeting.
- WTI $101.01, first sustained print above $100 since the late-April Hormuz spike; Tuesday range $98.02-$102.03
- Trump: US-Iran ceasefire on "massive life support"; Hormuz tanker flow remains effectively closed
- WTI structural map: $98 floor, $100 pivot, $103-$105 next resistance; $95 floor on a Beijing-brokered reset
- Iran chapter dominates the Trump-Xi summit agenda, compressing rare-earth and Boeing-order deliverables
- Sustained $100 WTI feeds straight into May CPI through retail gasoline pass-through
Crypto And Gold: Two Different Reads On The Stagflation Signal
Bitcoin holds $80,957 (+0.6% 24h) through the CPI release, the cleanest signal that the post-NFP $80K shelf is acting as the structural cycle support. Ethereum prints $2,300 on the live tape, roughly flat on the 24-hour and still 6% below its April 17 high of $2,460. The Fear and Greed Index remains in the Fear zone but spot ETF inflows continue to absorb the dip, with the multi-asset diffusion print last week showing $46M BTC, $21M Solana, $13M XRP and $12M ETH on the same session, a cycle template the institutional plumbing has now repeated three weeks running. Thursday's Senate Banking Committee markup of the CLARITY Act is the binary crypto-specific catalyst on the calendar; a bipartisan vote with structural support reopens the 2026 passage path that separates SEC and CFTC jurisdiction over digital assets.
Gold trades $4,734 Wednesday morning, up roughly 0.4% on the 24-hour and printing a daily range of $4,676 to $4,773. The metal's behavior into the CPI was the textbook two-sided trade: the hot print firmed the dollar and weighed mechanically through the rate-strip, but the stagflation signal and the Iran-Hormuz escalation supported the safe-haven bid into the close. The slower-moving structural story under the metal's price action is the Powell-to-Warsh Fed chair handover Friday May 15. Warsh's confirmation vote is expected this week and the institutional uncertainty premium it creates is a structural support for gold even as the cyclical CPI flow drives the day-to-day. For traders watching the metal, $4,775 is the recent ceiling and $4,650 is the structural support shelf if a hot PPI pulls the metal lower.
- BTC $80,957 (+0.6% 24h) holds the structural $80K shelf through the hot CPI release
- ETH $2,300, roughly flat 24h; still 6% below April 17 high of $2,460
- CLARITY Act markup Thursday; bipartisan vote reopens 2026 passage path for SEC/CFTC jurisdiction split
- Gold $4,734 (+0.4% 24h); key reference zone $4,775 ceiling, $4,650 structural support
- Powell-to-Warsh handover Friday May 15; institutional uncertainty premium is structural support for gold
The Trump-Xi Summit Lands Tomorrow With Iran On The Agenda
The Trump-Xi Beijing summit opens Thursday May 14 and runs through Friday May 15. The pre-summit framing through April set the agenda as a bilateral trade chapter centered on rare earths, soybean off-take, Boeing order placement and the AI export-control framework. The Iran rejection over the weekend has flipped the running order: Hormuz is now the lead topic, with the trade and AI chapters running on the back of whatever Iran-de-escalation framework Beijing can broker. Iran is China's largest oil customer, and Beijing's leverage on Tehran is meaningfully higher than Washington's. A clean Beijing-brokered Hormuz reset unwinds a meaningful piece of the May energy CPI pulse and is risk-on for equities, duration and crypto. An escalation locks in the $100 WTI shelf and rebuilds the December Fed hike skew.
For the full Beijing summit framing and the structural deliverables on each side, see Sunday's summit preview. For Tuesday's full CPI-day structural read going into the print, see yesterday's morning analysis. The week's binary catalyst stack into Friday's close: April PPI Wednesday 12:30 UTC, Senate Banking CLARITY Act markup Thursday, Trump-Xi summit Day 1 Thursday, Trump-Xi summit Day 2 plus Powell term expiry plus Warsh confirmation Friday.
- April CPI 3.8% / 2.8% hot print drives the December Fed hike skew to roughly 30%; PPI 12:30 UTC is the confirmation gate
- S&P 500 7,400.96 (-0.16%) holds the 7,400 shelf; rotation cuts semis (QCOM -12%, INTC -9%), bid into financials, energy, staples
- WTI broke $100 to $101.01; $98 floor, $103-$105 next resistance; sustained $100 feeds straight into May CPI
- Key levels to watch: SPX 7,425 / 7,375; WTI $103 / $98; BTC $82,500 / $79,000; XAU $4,775 / $4,650
- Trump-Xi Beijing summit Thursday-Friday with Iran-Hormuz dominating; CLARITY Act markup Thursday; Warsh confirmation expected this week
For positioning across the macro week, Bybit's TradFi platform offers tight spreads on US equity, FX and commodity exposures with defined-risk tooling. Not financial advice. Always do your own research.