
The Worst Week of the Iran War for Markets
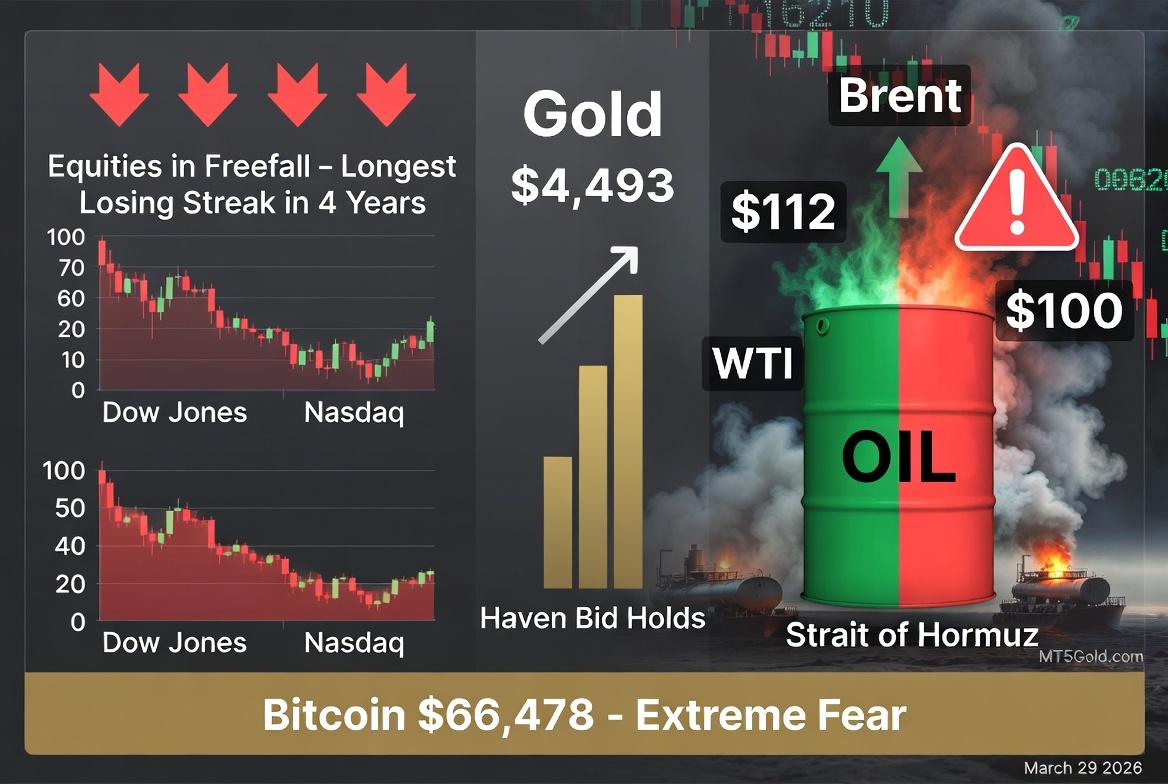
This was the week that broke the last holdouts. The Dow Jones Industrial Average entered correction territory on Friday, closing down nearly 800 points and officially 10%+ off its recent peak. The S&P 500 fell 1.67% on Friday alone, marking its longest weekly losing streak in four years. The Nasdaq confirmed correction earlier in the week and shed another 2.15% on Friday. All three major indices closed at their lowest levels since August.
The cause is singular and overwhelming: the Iran-Hormuz crisis. Four weeks into the US-Israeli military campaign against Iran, the Strait of Hormuz remains closed to commercial traffic. Iran's Foreign Minister rejected direct US peace talks on Thursday. Trump's April 6 deadline to reopen the strait is eight days away. And oil just broke through $100 WTI, with Brent trading at $112.57.
Everything else is downstream of that one story. Equities are selling because oil at $100+ feeds inflation and compresses margins. Crypto is selling because institutional risk is being reduced across the board. Gold is catching a haven bid. Defense stocks are holding. Energy stocks are rallying. The market is repricing for a world where the Middle East's most critical shipping lane stays shut indefinitely.
Oil: $112 Brent, $100 WTI, and the $150 Scenario
Brent crude closed the week at $112.57 per barrel (+4.22%). WTI touched $100.04 intraday before settling at $99.64 (+5.46%). Dubai physical crude hit $126. US gas prices reached $3.93/gallon.
The numbers tell a brutal story. The Strait of Hormuz carries roughly 20 million barrels per day, about 20% of all seaborne oil. It has been effectively shut since March 2. Iran replaced normal transit with a yuan-based toll system that only permits Chinese, Russian, and allied vessels. OECD inventories are now 180 million barrels below average. The IEA has called this worse than the 1970s oil crises.
And it could get worse. Reuters reported this week that traders are piling into options betting Brent will surge to $150 a barrel by the end of April. Goldman Sachs estimates a $14-18/bbl geopolitical risk premium is baked into current prices, meaning fundamentals alone would put WTI in the low-to-mid $80s. Major brokerages have been raising their 2026 average oil price forecasts all month.
The binary catalyst remains the April 6 deadline. A credible signal of Hormuz reopening sends oil down $15-20 in a session. No progress, and Brent tests $120+ next week.
The worst week for US equities since the Iran war began. Source: Business Insider
Equities: Correction Confirmed, Five-Week Bloodbath
The damage across US equities this week was broad and deep:
- S&P 500: Down ~2% for the week, fifth consecutive weekly decline. Closed at roughly 5,580, the lowest since August
- Dow Jones: Shed nearly 800 points on Friday, officially entering correction (10%+ drawdown from peak). Lowest close since August
- Nasdaq Composite: Down 3.2% for the week. Already confirmed correction earlier. 355 new 52-week lows on Friday
Declining issues outnumbered advancers by a 3.38-to-1 ratio on the NYSE and 3.62-to-1 on the Nasdaq. Amazon led the Dow's decliners. The S&P 500 posted just 22 new 52-week highs versus 27 new lows. European markets also closed red: DAX down, Stoxx 600 slipping nearly 1%.
The drivers are compounding. Oil at $100+ feeds inflation expectations, pushing Treasury yields higher and compressing tech multiples. The Fed's March stance of just one rate cut for 2026 removed a tailwind. And Trump's extension of the Iran deadline to April 6 failed to provide relief; markets interpreted it as evidence that the conflict has no near-term resolution.
The S&P 500 is on track to finish Q1 in negative territory. History offers some comfort here: in past instances where the S&P fell in Q1, it often recovered substantially by year-end. But that recovery requires the macro backdrop to stabilize, and right now it's getting worse.
Gold: $4,493 and the Haven Bid Holds
Gold closed the week at $4,493 per ounce, up roughly 1.4%. The haven bid from Iran tensions has stabilized gold in the $4,370-$4,510 range after the correction from January's $5,589 all-time high. With Extreme Fear in crypto, equities posting their fifth straight weekly loss, and oil threatening global growth, gold continues to attract capital looking for shelter.
The technical picture has gold trading within a narrowing range. The $4,373 floor held through the week's volatility. If gold can sustain above $4,500, it opens the path toward $4,600+. A break below $4,373 targets $4,300 and potentially the 200-day EMA at $4,200, which has not been broken since late 2023.
Goldman Sachs targets $5,400 year-end. JPMorgan's de-dollarization scenario goes to $6,000. Central bank gold buying continues, and the de-dollarization narrative has only accelerated since Iran launched its yuan-based Hormuz toll. These structural tailwinds remain intact regardless of short-term volatility.
Bitcoin: $66,478 With Fear at Record Lows
Bitcoin sits at $66,478, up a marginal 0.45% over 24 hours but still deeply in the red on a monthly basis. The Fear and Greed Index has cratered to 9, Extreme Fear, the lowest reading in months and near the absolute floor of the scale.
The macro compression on crypto is clear: higher real yields raise the opportunity cost of holding non-yielding assets, and institutional traders are reducing risk across every asset class with oil above $100 and equities in correction. Bitcoin ETFs saw $171 million in outflows on Thursday alone, the largest single-day outflow in three weeks.
Mining economics remain broken. The average production cost sits around $88,000 per BTC according to Checkonchain's difficulty regression model. With BTC at $66K, miners are losing roughly $22,000 on every coin produced. The difficulty just dropped 7.76% and hashrate has retreated to ~920 EH/s. Publicly listed miners are pivoting to AI/HPC contracts and selling bitcoin treasuries, adding sell pressure.
Crypto exchange activity has been dominated by risk reduction. Liquidations on exchanges like Bybit and others surged past $250M in the last major selloff. Funding rates are negative, open interest has declined, and correlation to equities remains high.
Contrarian signal: on-chain data shows whale accumulation continuing and exchange outflows rising. Long-term holders are not selling. Extreme Fear has historically been a medium-term buy signal, but you need a macro catalyst to flip sentiment, and right now that catalyst is a geopolitical event, not a data release.
Stocks & ETFs: Winners, Losers, and What to Watch
The war is creating clear winners and losers across sectors:
Winners this week:
- XLE (Energy Select Sector ETF): The cleanest oil trade. Energy stocks are the standout sector of 2026, with Kosmos Energy (KOS) the best-performing stock YTD. Exxon (XOM), Chevron (CVX), and Occidental (OXY) are all benefiting directly from WTI near $100
- Defense names (RTX, LMT, NOC): Quiet outperformers in the conflict environment. All held relatively well while tech sold off
- GLD (SPDR Gold Shares): Tracking gold's safe-haven rally. Up with spot gold at $4,493
- VDE (Vanguard Energy ETF): Among the best-performing Vanguard ETFs in March alongside VPL (Pacific)
Losers this week:
- QQQ (Nasdaq 100 ETF): Correction confirmed. Down 3.2% for the week. Oversold short-term but no bounce catalyst without macro relief
- SPY (S&P 500 ETF): Five-week losing streak. $560 is critical support. Below that, $545 is the next target
- Tech mega-caps (AMZN, AAPL, META, NVDA): All in the red. Broad institutional deleveraging, not rotation
- Crypto ETFs: $171M outflows Thursday. Retail selling widespread
Watch list:
- USO (Oil ETF): Direct WTI exposure. Binary risk around April 6 deadline
- SMH (Semiconductor ETF): If semis break support, could trigger the next leg lower for tech
Economic Calendar: March 30 - April 4
The week ahead is loaded with data that could reset expectations. And Good Friday closes US and European markets on April 3.
- Monday, March 30: Germany Harmonized CPI (preliminary). Japan Tokyo CPI. Markets reopen with the April 6 Hormuz deadline looming. Watch oil's gap at the open
- Tuesday, March 31: China NBS Manufacturing PMI. Germany Retail Sales. UK GDP (final). Eurozone CPI (flash). Japan Tankan Large Manufacturers Index. End of Q1 brings portfolio rebalancing flows
- Wednesday, April 1: China Caixin Manufacturing PMI. US ADP Employment Report. ISM Manufacturing PMI (key inflation/supply chain signal, expect responses to reflect the oil shock). US Retail Sales
- Thursday, April 2: Australia Trade Balance. Switzerland CPI. US Weekly Jobless Claims. Factory Orders
- Friday, April 3: Good Friday - US and European markets closed. China Caixin Services PMI. US Non-Farm Payrolls (NFP) for March. US ISM Services PMI. (NFP releases despite holiday, but equity markets are shut, so forex and futures will carry the reaction into Monday April 6)
The NFP print on April 3 is the big number. A strong labor market reading while oil-driven inflation is rising puts the Fed in a bind. Stagflation scenarios are being priced at the margins. A weak number opens the door for rate cuts but signals economic deterioration. Either outcome adds volatility. The fact that equity markets are closed for Good Friday means the full reaction to NFP plays out when markets reopen on Monday April 6, the same day as Trump's Hormuz deadline.
The Week Ahead: Two Deadlines Collide
Monday April 6 is shaping up as one of the most significant trading days of 2026. Two events converge:
- Markets reopen after Good Friday with the NFP reaction still unprocessed by equities
- Trump's April 6 deadline for Iran to reopen the Strait of Hormuz expires
If NFP is weak and the Hormuz deadline passes without progress, you get a stagflation + escalation double-hit. If NFP is strong and there is any diplomatic signal, you get a relief rally. The range of outcomes is enormous.
For gold traders specifically: XAUUSD is expected to trade within the $4,376-$4,510 range when markets reopen Monday. The key question is whether gold breaks above $4,500 resistance on safe-haven flows or sells on a risk-on reversal. With the conflict showing no signs of resolution, the bias leans toward further haven accumulation.
For those trading gold CFDs or indices through platforms like Bybit TradFi, position sizing matters more than conviction this week. The volatility regime calls for smaller positions and wider stops.
The Bottom Line
This was the worst week for markets since the Iran war began. The Dow is in correction. The S&P 500 is on its longest losing streak in four years. Oil is above $112 Brent. The Fear & Greed Index hit 9. And there is no diplomatic off-ramp visible.
The market has moved from pricing in "disruption" to pricing in "duration." Traders are no longer asking if Hormuz will reopen but how long it stays closed. That shift changes everything: from energy costs to corporate margins to central bank policy.
April 6 is the line in the sand. Until then, expect continued volatility, continued haven flows into gold, and continued pain for risk assets. The only trade that has worked consistently in March 2026 is long oil and long gold. Everything else has been caught in the crossfire.
All times UTC. All prices as of 2026-03-29 11:00 UTC.