The Week in One Sentence
Trump threatened to bomb Iran back to the Stone Age, oil spiked 11% in a single day, then the US jobs market printed 178,000 new jobs — three times the forecast — and somehow the S&P 500 ended the week up 3.4%. Welcome to markets in April 2026.
The Big Story: Iran, Hormuz, and $111 Oil
The defining moment of the week came Wednesday night, when President Trump delivered a televised address and promised to hit Iran "extremely hard" in the coming weeks. He threatened strikes on bridges, power plants, and critical infrastructure — a stark escalation from the limited military campaign that began on February 28.
Markets reacted instantly. Brent crude surged 8% on Thursday, touching $109.74 per barrel before settling around $107.57. WTI — the US benchmark — spiked an extraordinary 11% to $111.29 per barrel, the highest since early March. The inversion of the Brent/WTI structure (normally WTI trades below Brent) reflects the unique stress on US domestic markets as the Iran conflict tightens global supply chains.
The numbers behind the fear: the Strait of Hormuz handles roughly 20% of global oil supply. Iran has been disrupting traffic since February. A full closure scenario, modelled by Goldman Sachs and Bloomberg, puts Brent between $150-$170 — a stagflationary shock that would reprice virtually every asset class on the planet. That tail risk is why markets remain on edge even when day-to-day moves appear calm.
There was a brief moment of relief mid-week. Reports emerged that Iran and Oman were drafting a protocol to allow some marine traffic through the Strait, and Brent briefly dropped below $100. Then Trump's speech killed that hope. By Thursday's close, Brent was back above $106.

Brent crude briefly touched $109.74 on Thursday as Trump escalated rhetoric against Iran, before easing to ~$107 on partial Hormuz protocol reports. WTI reached $111 — inverting the normal Brent/WTI spread.
For traders, the key tension is this: oil above $110 is structurally inflationary. The Federal Reserve has no political room to cut rates into an oil shock. That keeps real yields elevated, pressures risk assets, and creates a ceiling for gold rallies. But it also keeps the geopolitical risk premium alive — which is why safe havens like gold and the dollar are outperforming equities in 2026 even as the stock market grinds higher.
Jobs Blowout: NFP 178,000 vs. Forecast 59,000
Friday delivered the week's other bombshell. The Bureau of Labor Statistics reported March nonfarm payrolls at 178,000 — nearly triple the consensus estimate of 59,000 and a dramatic reversal from February's -133,000 decline (the February number was distorted by winter storms and Iran-related supply chain disruptions).
Unemployment ticked up slightly to 4.3% from 4.4%. Wage growth came in at 0.3% month-on-month, modestly below the 0.4% prior reading. Job gains were concentrated in healthcare, construction, and transportation and warehousing — sectors relatively insulated from the oil shock's drag.
The reaction in markets: rate-cut bets collapsed. Traders who were pricing in Fed easing by June rapidly unwound those positions. The dollar strengthened. Gold initially dropped. But the S&P 500 didn't sell off — instead, the "strong economy" narrative provided a floor under equities even as rate cut hopes faded. It's a classic late-cycle dynamic: strong jobs are good for earnings but bad for bonds, creating cross-asset confusion.
Gold: A Month of Pain, A Week of Consolidation
Gold's weekly story is best understood in context. The metal traded around $4,677 per ounce by Friday (April 3) — down from a peak of $5,595 set on January 29, 2026, and down from $5,161 just a month ago. That's a roughly 13-16% correction from the highs.
The drivers of the selloff are interconnected: a stronger dollar (oil shocks typically boost the greenback), rising US real yields as rate cuts get priced out, and profit-taking from investors who rode gold's extraordinary 54% year-over-year gain. Gold is now up 54% versus a year ago (from $3,037), but the near-term momentum has clearly shifted.
Thursday's session was particularly brutal. Gold crashed from ~$4,700 to $4,600 intraday after Trump's speech triggered a rate spike and dollar surge. It snapped back to $4,672 by the close as safe-haven buying returned — a $100 intraday range that illustrated exactly how headline-driven this market has become. Trading gold CFDs on platforms like Bybit TradFi during these volatile sessions requires tight risk management; the spread between safe-haven demand and dollar strength can flip direction within minutes.
Key levels: $4,550-$4,600 is the support zone. A sustained break below risks a test of $4,200-$4,300 cycle lows. Resistance sits at $4,750-$4,800. Goldman Sachs maintains a $5,400 target; UBS projects $6,200 by year-end. The long thesis remains intact — Iran, Fed uncertainty, and central bank buying provide structural support. But the short-term path is bumpy.
Stocks and ETFs: The S&P's Counterintuitive Rally
Despite the geopolitical chaos, the S&P 500 finished the week up 3.4% — driven primarily by energy sector gains (oil companies love $110 oil) and a bounce from deeply oversold conditions. Year-to-date, the index remains down approximately 5% as of late March, but the weekly rebound suggests some buyers are stepping in.
The sector breakdown tells the real story:
- Energy (XLE) — the week's outperformer, up sharply as oil producers like BP and Shell each gained ~3% on Thursday alone
- Technology (QQQ/Nasdaq) — modest recovery, but still vulnerable to rising real yields which compress tech valuations
- Small caps (Russell 2000) — bear market territory, down over 6% recently; small caps are more sensitive to domestic economic conditions and credit costs
- Healthcare (XLV) — defensive strength; down 3% YTD but holding better than most cyclicals
- Gold miners (GDX) — underperformed gold itself this week as the broader correction weighed on miners disproportionately
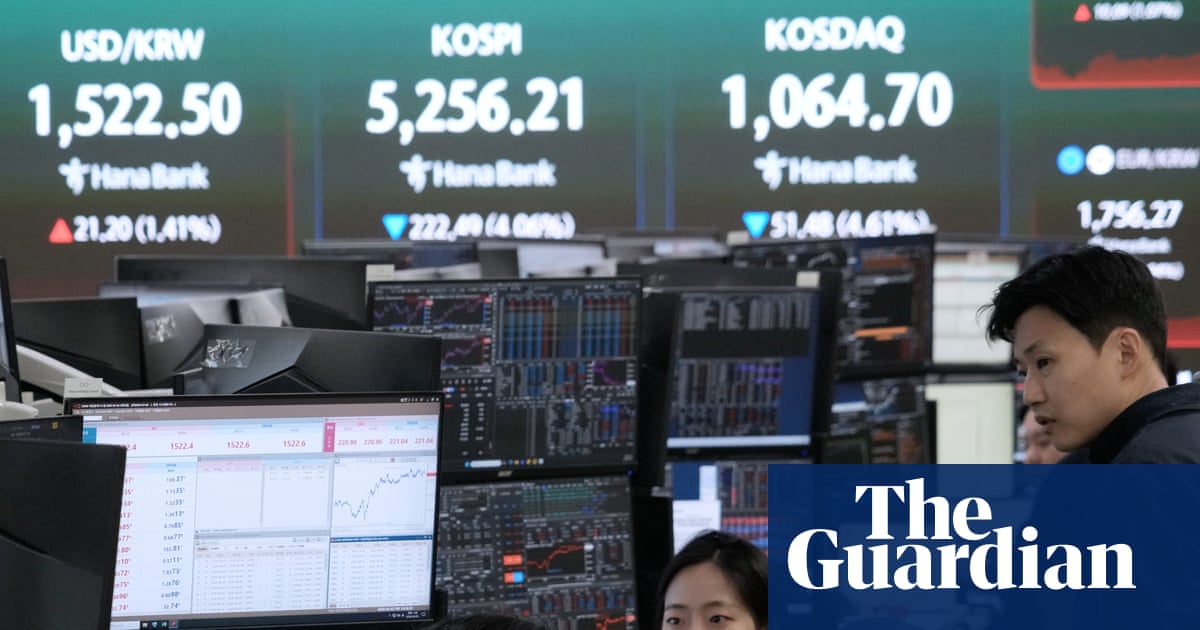
International markets had a rougher week. Japan's Nikkei fell 2.4% on Thursday. South Korea's Kospi tumbled 4.8%. China's CSI 300 dropped 1.36%. European indices were mixed — the FTSE 100 actually gained 0.7% as its heavy energy exposure (BP, Shell) turned the oil shock into a tailwind. Stocks like NVDA, AAPL, and TSLA are also accessible via Bybit TradFi for those looking to trade US equities alongside gold and crypto in one platform.
One year on from "Liberation Day" (April 2, 2025), the tariff anniversary dominated financial media this week. The US Supreme Court ruled Trump's broad tariff regime illegal in February 2026. Trump responded by launching Section 301 investigations into 12+ trading partners and imposing a new 10% "universal" tariff (to be raised to 15%). The "Sell America" trade — which saw the dollar, Treasuries, and US equities all fall simultaneously last April — has not fully repeated, but international markets have outperformed the S&P 500 over the past year.

Energy and defense ETFs have been the standout performers in 2026 as the Iran conflict reshapes sector leadership. The S&P 500 ended the week up 3.4% despite geopolitical turbulence.
Bitcoin and Crypto: Extreme Fear, Stubborn Price
Bitcoin is trading at $66,925 as of Saturday morning — essentially flat on the week, up a fractional 0.28% over 24 hours. The price has been consolidating in the $65,000-$68,000 range for most of the past two weeks. Down approximately 45% from its all-time high, BTC is stabilising but not recovering.
The Crypto Fear & Greed Index hit 11 — Extreme Fear this week, one of its lowest readings in months. The macro environment explains the paralysis: oil above $110, Fed rate cuts priced out by the NFP blowout, and genuine uncertainty about whether the Iran conflict escalates further. Crypto doesn't trade in isolation from macro forces in 2026 — when real yields rise and the dollar strengthens, risk assets including Bitcoin face headwinds.
The bullish case: several analysts, including Goldman Sachs and CryptoDCX, project BTC reaching $72,000-$73,000 by mid-April if macro conditions stabilise. The 200-day moving average has been falling since early March, but the weekly timeframe shows BTC remains technically bullish with the 50-day MA rising. A resolution to the Iran conflict — or any Fed pivot signal — could be the catalyst for the next leg up.
Ethereum sits around $2,049, down slightly on the week. Total crypto market cap remains under pressure. Liquidations across major exchanges including Bybit have been elevated during the sharp intraday swings, with both long and short positions getting flushed during the high-volatility sessions triggered by Trump's Wednesday speech.
Economic Calendar: Week of April 6
Markets will have a shortened open on Monday (April 6) as some regions observe Easter Monday. Key events for the week ahead:
- Mon, Apr 6 — Easter Monday (partial market closures in Europe and Australia); XAUUSD expected to resume trading in the $4,576-$4,760 range per LiteFinance technical analysis
- Tue, Apr 7 — US ISM Services PMI; any reading below 50 would reignite recession fears given the oil shock backdrop
- Wed, Apr 8 — FOMC Minutes from the March 18-19 meeting released at 18:00 UTC; traders will parse language on inflation tolerance and the path to rate cuts given the energy price surge
- Thu, Apr 9 — US Initial Jobless Claims; following the strong NFP print, claims data will be watched for signs of any labour market deterioration
- Fri, Apr 10 — US CPI (March) — the most critical data point of the week. Oil above $110 will almost certainly push headline CPI higher. A print above 3.5% year-on-year would likely accelerate the "no cuts in 2026" narrative and pressure risk assets. Gold and oil will move sharply on this release.
The geopolitical wildcard remains the dominant variable. Any escalation in the Iran conflict — or conversely, any credible ceasefire signal — will override all economic data releases. Watch Trump's Truth Social feed and Iranian Foreign Ministry statements as closely as any economic indicator this week.
Week Ahead Outlook
Three scenarios to consider for the week of April 6:
Bull case: Iran-Oman protocol formalised, Hormuz traffic partially resumes, oil falls back toward $90-$95. Rate cut expectations recover. S&P 500 extends rally toward 6,700-6,800. Gold bounces toward $4,800-$4,900. BTC tests $70,000.
Base case: Geopolitical uncertainty persists. Oil trades in the $100-$115 range. CPI prints hot. Fed stays on hold. Markets consolidate sideways. Gold holds $4,500-$4,700 range. BTC stuck at $65,000-$68,000.
Bear case: Trump escalates strikes, Iran closes Hormuz tighter. Oil spikes above $120. CPI blows out. Fed forced to raise rates to defend dollar and inflation expectations. S&P 500 breaks below 6,000. Gold drops below $4,400 on dollar strength. BTC tests $60,000.
The base case is most probable, but the distribution of outcomes is unusually wide. Position sizing accordingly — this is not the environment for concentrated leveraged bets in any direction.