What Is CPI?
The Consumer Price Index (CPI) measures the average change in prices paid by consumers for a basket of goods and services — everything from rent and groceries to gasoline and medical care. It is the most widely watched inflation gauge in the world.
The U.S. Bureau of Labor Statistics releases CPI data monthly. Markets move on this number because it directly influences Federal Reserve policy. Higher inflation = rates stay high or go higher. Lower inflation = rate cuts become possible. For traders, CPI is a volatility event that moves stocks, bonds, crypto, and commodities simultaneously.
Today's Numbers (February 2026)
- Headline CPI: +0.3% MoM, +2.4% YoY — exactly in line with consensus
- Core CPI (ex food & energy): +0.2% MoM, +2.5% YoY — slightly cooler than the 0.3% MoM expected
- Food: +0.4% MoM, +3.1% YoY — food prices still elevated
- Energy: +0.6% MoM, +0.5% YoY — modest, but this is PRE-WAR data
- Shelter: +0.2% MoM, +3.0% YoY — the largest contributor to headline inflation
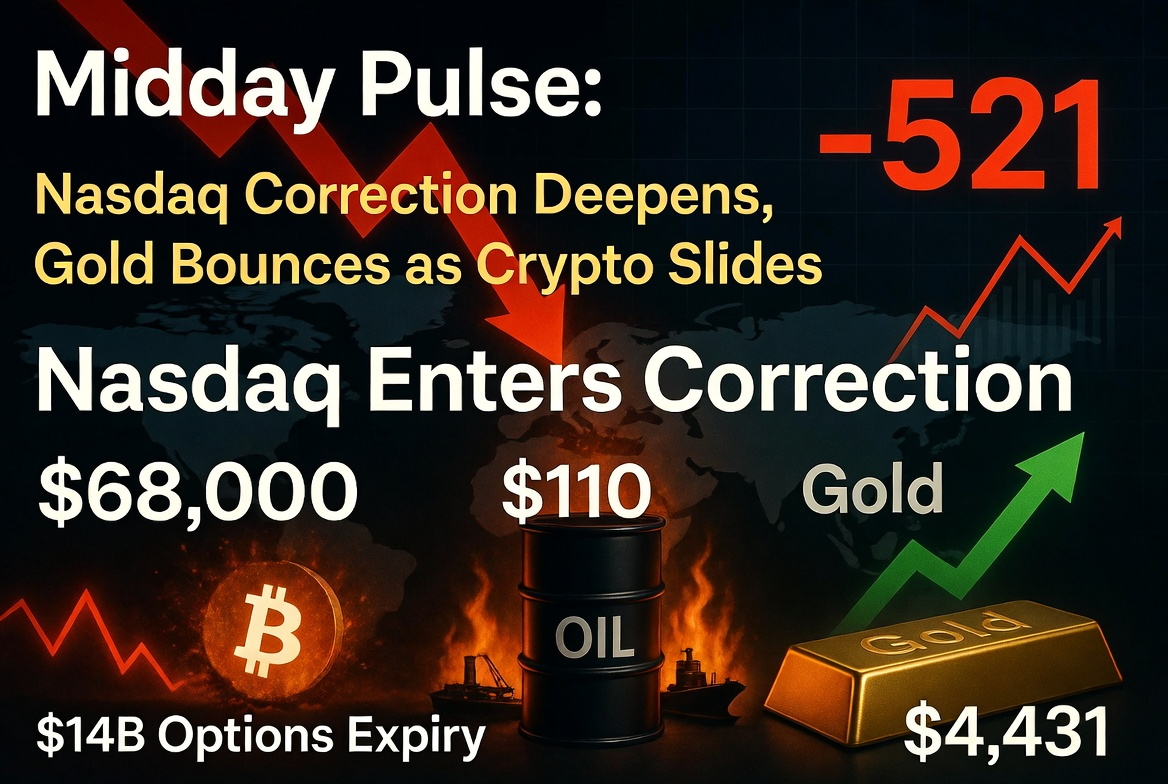
Market Reaction
Initial reaction was muted. No surprise = no panic. The cooler core reading is mildly bullish for risk assets, suggesting underlying inflation pressures are fading. But traders know the elephant in the room:
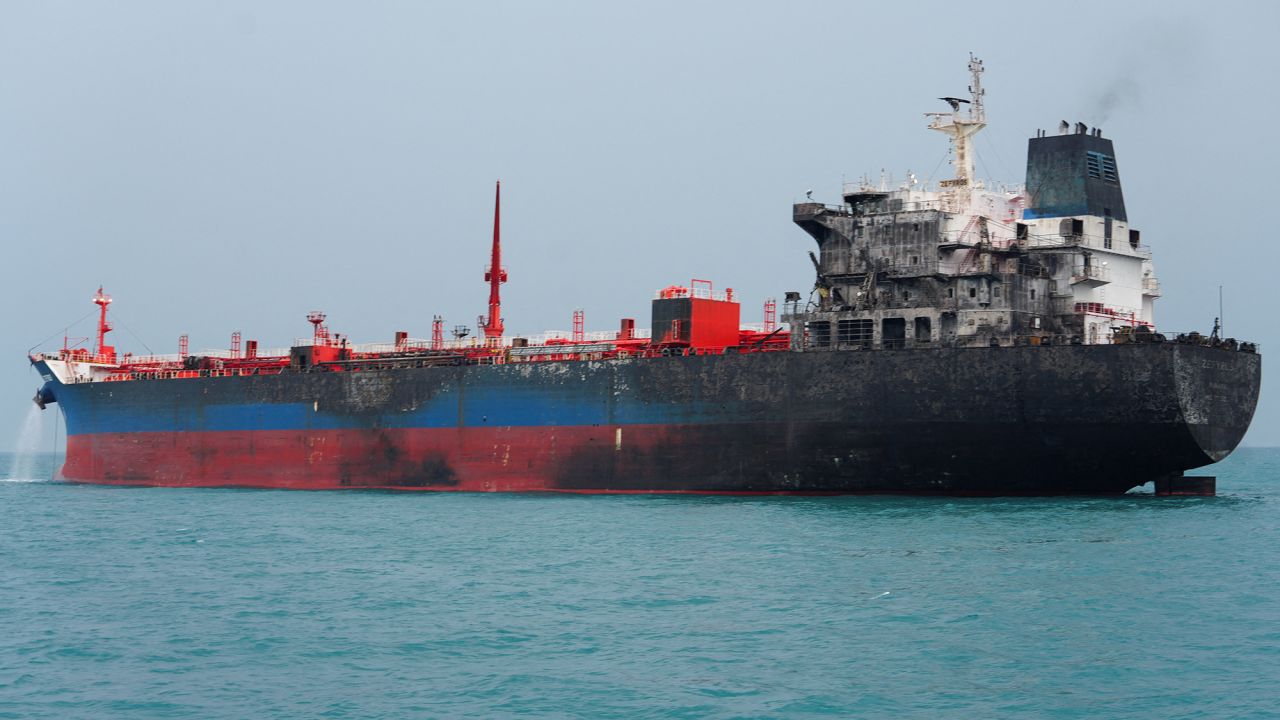
This data covers February — before the US-Israel strikes on Iran (Feb 28), before oil surged above $100, and before the Strait of Hormuz blockade. The March and April CPI prints will capture the oil shock, and those numbers could be ugly.
What This Means for Each Market
- Bitcoin: Neutral to slightly bullish short-term. No hot CPI surprise removes one bearish catalyst. But BTC remains macro-driven by Iran headlines, not inflation data.
- Gold: Bullish. In-line CPI means the Fed stays on hold. Gold thrives in a "no rate hikes but no cuts either" environment, especially with war premium intact.
- S&P 500: Mild relief. The in-line print removes a tail risk. But the forward-looking inflation risk from oil keeps a ceiling on any rally.
- Oil: Unaffected by CPI. Oil is trading on Hormuz headlines, not backward-looking inflation data.
The Bigger Picture: Stagflation Risk
Today's CPI looks tame. But here is the concern: oil at $85-92 will flow into March and April CPI prints. If headline inflation jumps back above 3% while the economy slows, we are in stagflation territory — the worst possible outcome for the Fed. They cannot cut rates (inflation too high) and they cannot raise them (economy too weak).
The Fed's next meeting is March 18-19. Today's data gives them cover to hold rates steady. But if the Iran conflict drags on and oil stays elevated, the conversation shifts from "when do we cut?" to "do we need to hike again?"
Where to Watch CPI Live
- U.S. Bureau of Labor Statistics — Official CPI data
- New York Times — CPI Live Updates
- Forex Factory — Economic Calendar
CPI is released on the second or third Tuesday/Wednesday of each month at 8:30 AM Eastern (12:30 UTC). Next release: April 10, 2026 — that will be the first print capturing the Iran war oil shock.