If you trade any market — crypto, forex, indices, gold — you need to understand market structure. Two concepts sit at the core of every price action strategy: Break of Structure (BOS) and Market Structure Break (MSB). They tell you when a trend continues and when it reverses.
Most traders confuse the two or use them interchangeably. They are not the same thing. Here is the difference, why it matters, and a free TradingView indicator that plots both automatically with alerts.
What is Break of Structure (BOS)?
BOS confirms the current trend is continuing. In an uptrend, price makes higher highs and higher lows. When price breaks above the most recent swing high, that is a BOS — the trend just confirmed itself.
- Bull BOS: Price breaks above a swing high in an uptrend. Buyers are still in control.
- Bear BOS: Price breaks below a swing low in a downtrend. Sellers are still in control.
Think of BOS as the market saying "same direction, keep going." It is a continuation signal.
What is Market Structure Break (MSB)?
MSB signals a potential trend reversal. In an uptrend, if price breaks below the most recent swing low instead of making a higher low, that is an MSB. The structure just broke — the trend might be flipping.
- Bull MSB: In a downtrend, price breaks above a swing high. Potential shift to bullish.
- Bear MSB: In an uptrend, price breaks below a swing low. Potential shift to bearish.
MSB is the market saying "something changed." It is a reversal signal. Some traders call this a Change of Character (CHoCH) — same concept, different name.
Why This Matters for Your Trading
Understanding BOS vs MSB changes how you read any chart:
- BOS = trend continuation. Look for pullback entries in the same direction.
- MSB = potential reversal. Tighten stops, take profits, or look for entries in the opposite direction.
- Multiple timeframe confluence: An MSB on the 1H while the daily is still showing BOS? The daily trend probably wins. An MSB on the daily? Pay attention.
- Alert-based trading: Set alerts on MSB signals across multiple pairs and timeframes. Let the market come to you instead of staring at charts all day.
The Best Free BOS/MSB Indicator for TradingView
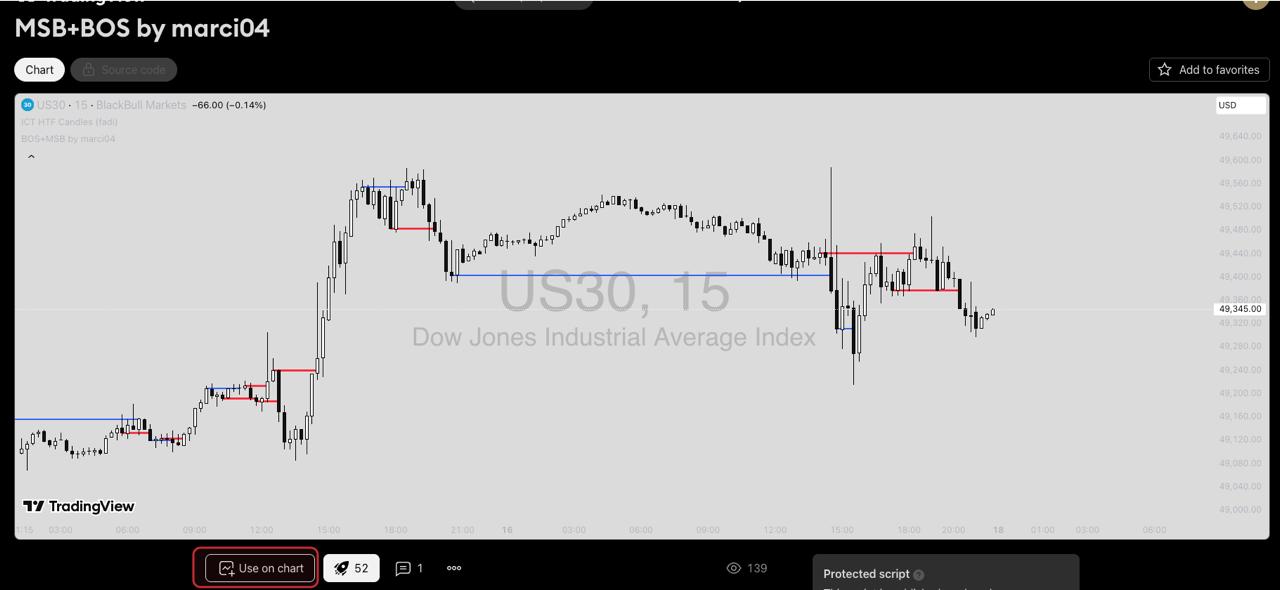
The MSB+BOS by marci04 indicator is one of the cleanest implementations available on TradingView. It is free, lightweight, and does exactly what you need:
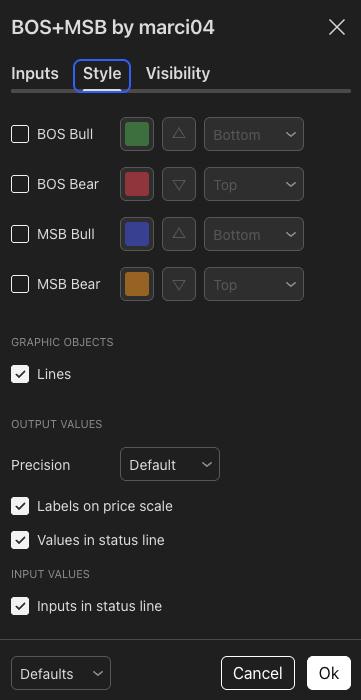
- Blue lines mark BOS levels (trend continuation)
- Red lines mark MSB levels (potential reversal)
- Built-in alerts for Bull BOS, Bear BOS, Bull MSB, and Bear MSB
- Works on any symbol and any timeframe
- Clean visual output that does not clutter your chart
How to Add It to Your Chart
- Open MSB+BOS by marci04 on TradingView
- Click "Add to favorite indicators"
- On any chart, open Indicators and search "MSB BOS marci04"
- Click to add it to your chart
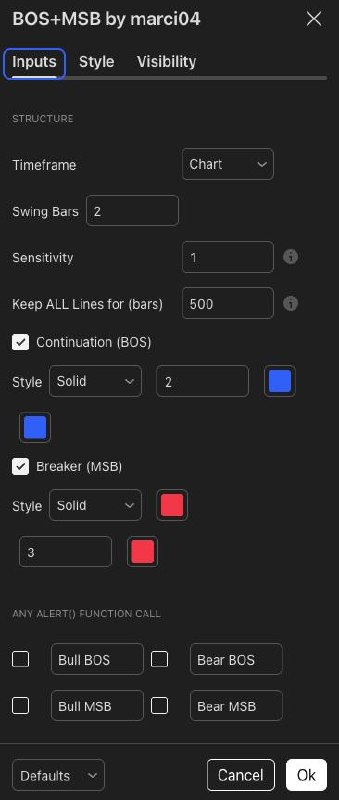
Recommended Settings
The default settings work well for most traders:
- Swing Bars: 2 (default) — how many bars define a swing point. Increase to 3-4 for less noise on lower timeframes.
- Sensitivity: 1 (default) — lower means fewer signals but higher quality.
- Keep ALL Lines for (bars): 500 — how far back lines extend. Lower this if your chart feels cluttered.
Setting Up Alerts
This is where the indicator really shines. Instead of watching charts, set alerts:
- Add the indicator to your chart
- Click the alert icon (clock with +) on TradingView
- Select "MSB+BOS by marci04" as the condition
- Choose your alert type: Bull BOS, Bear BOS, Bull MSB, or Bear MSB
- Set notifications to your phone, email, or webhook
Pro tip: Set MSB alerts on the 1H and 4H timeframes for your main pairs. When an MSB fires on a higher timeframe, drop down to the 15M to look for entries. This multi-timeframe approach filters out noise and catches real reversals.
How We Use BOS/MSB in Our Trading
Understanding market structure is the foundation of both discretionary and systematic trading. Break of Structure and Market Structure Break are core concepts that describe how institutional order flow transitions from one regime to the next on any timeframe.
Whether you trade manually with this TradingView indicator or build a rule-based system around it, BOS and MSB are not fancy concepts — they are how price moves. Learn to read them and you read the market.