
The Biggest Story: Oil Heads for Its Best Month Since 1990
Five weeks into the U.S.-Israel war against Iran, Brent crude is closing March with a gain of approximately 55% - the biggest monthly surge for the contract since its inception in 1988. The previous record was a 46% gain in September 1990 when Saddam Hussein invaded Kuwait. Brent traded at $112.72 by Monday's session, with WTI at $103.47. The math is stark: the world is short oil, and every escalation tightens the chokepoints further.
President Trump escalated his rhetoric on Monday, warning Iran that the U.S. would destroy its oil wells, power plants, and Kharg Island - through which roughly 90% of Iran's oil exports flow - unless the Strait of Hormuz was reopened. In an FT interview over the weekend, Trump said his preferred outcome was to "take the oil," drawing a comparison to U.S. actions in Venezuela. Markets are now pricing this as more than posturing. David Roche of Quantum Strategy notes that a move on Kharg Island would choke off Iran's dollar revenues but risk triggering full-scale retaliation against Gulf infrastructure.
The Houthis opened a new front Saturday, launching their first direct missile strikes on Israel - marking the Yemen-based group's formal entry into the conflict on Iran's side. Societe Generale's global commodities head Michael Haigh told CNBC that if the Bab el-Mandeb Strait is disrupted on top of the already-constrained Strait of Hormuz, the market loses another 4-5 million barrels per day. His bank's analysts have flagged a potential path to $150/barrel in April if disruptions deepen.
Bitcoin: $14B Options Expiry Meets Geopolitical Pressure
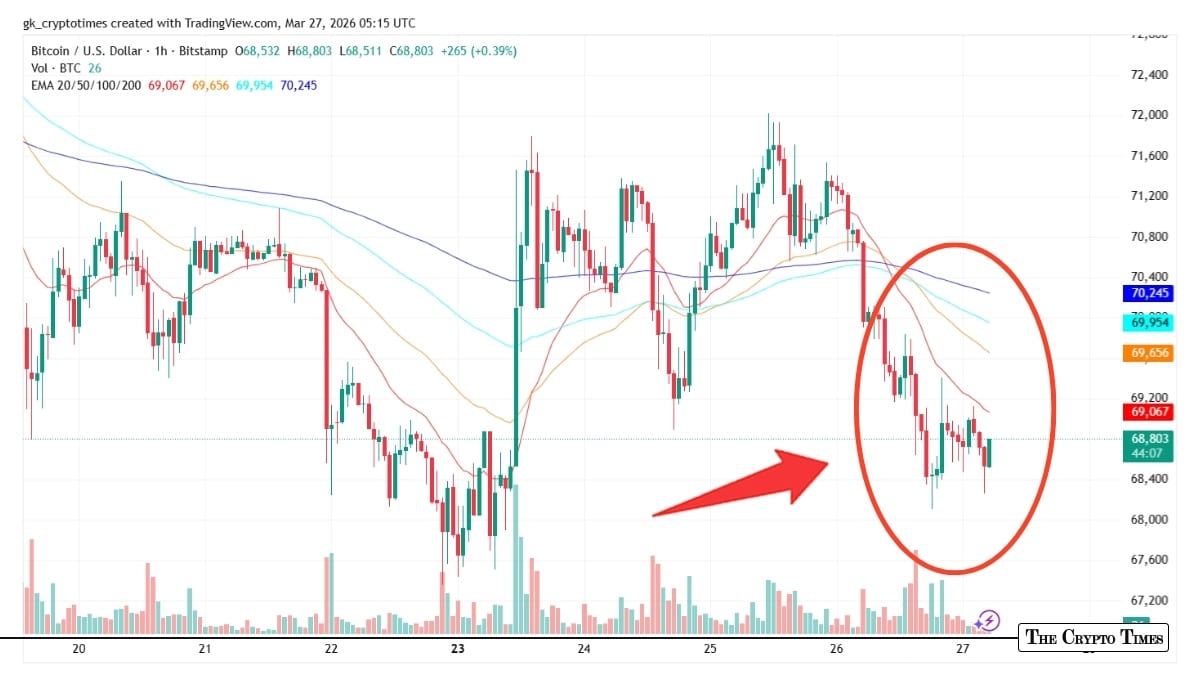
Source: CryptoTimes
Bitcoin is trading at $66,525, up just 0.23% on the 24-hour period but well off the session lows. Earlier today, the $14.16 billion BTC options expiry on Deribit - the largest of 2026, representing 40% of all open interest - settled at 08:00 UTC with max pain at $75,000. With BTC trading roughly $9,000 below max pain, the mechanical unwind of positions was brutal: over $115 million in BTC longs were liquidated in one hour, and $70 billion was erased from the total crypto market cap in four hours.
The session low hit around $65,112 before buyers stepped in. Analysts at Bybit and other major exchanges noted that ETF outflows of $171 million on March 26 had already weakened the bid, and Ethereum ETFs have now recorded seven consecutive days of outflows totaling $92.54 million. Crypto Patel flagged a bear flag pattern on the daily chart - the same setup that preceded BTC's drop from $89,000 to $60,000 earlier this year. A daily close below $66,000 puts the $46,000 bear case in play technically. A hold opens the lower $60K range as the next major support zone where at least one prominent analyst (van de Poppe) is positioned to buy.
The divergence between gold and BTC is notable. Gold surged while BTC sold off today, reversing a pattern from earlier this month when BTC outperformed every safe-haven asset in the first days of the conflict. The safe-haven rotation has flipped back to traditional assets on the fresh Houthi escalation.
Gold: Holding Near Record Territory at $4,529
Gold spot is at $4,529/oz, having briefly touched $4,438 on intraday volatility before recovering. LiteFinance's forecast model puts the trading range for March 31 between $4,376 and $4,577. Gold has been the cleaner safe-haven play this conflict cycle - rising above $5,400 at the peak before pulling back as BTC initially absorbed some of the flight-to-safety capital. The pullback from those highs reflects the complexity of gold's position: it benefits from war risk but faces headwinds from elevated Treasury yields, which compete for haven capital.
XAU/USD key levels to watch: $4,500 is the immediate floor. A break below risks a move toward $4,376 (LiteFinance lower bound). On the upside, a return toward $4,577 would signal risk premium re-expansion if Iran conflict news worsens overnight. Gold's trajectory into April hinges almost entirely on whether Trump follows through on the Kharg Island threat and what Iran's response is.
Equities: S&P 500 Flat, Dow Holds Green, Nasdaq Lags
U.S. equities spent the day in a tug-of-war between Iran war fears and resilient economic data. The S&P 500 was down marginally at -0.06%, the Nasdaq off 0.39%, the Russell 2000 down 1.45%, and only the Dow managed a small gain of +0.40%. The S&P closed its fifth consecutive losing week on Friday (down ~1.73% for the week). Ed Yardeni of Yardeni Research warns that global equities are beginning to price in "higher-for-longer" oil and interest rates - a stagflationary scenario that historically hits growth stocks hardest.
The inflationary feedback loop is the core concern. Oil at $112 feeds directly into CPI. Higher CPI pushes the Fed further from cuts. Fewer cuts mean higher discount rates, which compress equity multiples. The market was pricing better than 50% odds of a rate hike as recently as Friday morning before Powell cooled that speculation.
Tomorrow's Economic Calendar: What to Watch (UTC)
Tuesday March 31 is end-of-month and end-of-quarter - which amplifies every data release as portfolio managers rebalance.
- 09:00 UTC - Eurozone CPI Flash Estimate (March): Forecast ~2.2% vs. previous 2.3%. Elevated energy prices from the oil surge should push headline CPI higher than expected. If it prints above 2.5%, it complicates the ECB's rate path and is bearish for European equities and EUR. Directly relevant: oil's 55% monthly gain will show up in European energy prices with a lag, making the next 2-3 CPI prints the most important data points the ECB faces.
- 13:45 UTC - Chicago PMI (March): Forecast ~46.0 vs. previous 45.5. Manufacturing has been contracting. A print below 45 would deepen recession fears; a surprise above 50 could give U.S. equities a brief relief rally. Watch for the employment and new orders sub-components - they lead ISM Manufacturing by 1-2 weeks.
- 14:00 UTC - CB Consumer Confidence (March): Forecast ~93.0 vs. previous 98.3. This will capture consumer reaction to the oil shock and equity market decline. A significant miss would confirm demand destruction is starting - bearish for risk assets but perversely could revive rate cut expectations and support BTC. Gasoline prices above $4/gallon in many U.S. states will drag this number.
- 14:00 UTC - JOLTS Job Openings (February): Forecast ~7.6M vs. previous 7.7M. Labor market resilience has been the key argument against a Fed pivot. Any softening here reopens the rate cut conversation and could be the catalyst BTC needs to stabilize above $66,000.
End-of-quarter flows are wild cards. Pension funds rebalancing out of equities (which underperformed bonds in Q1) into fixed income could add selling pressure to stocks through the morning session. Gold and BTC may benefit from any dollar weakness that accompanies quarter-end flows.
Stocks and ETFs to Watch
- XLE (Energy Select Sector ETF): Directly exposed to oil price trajectory. With Brent up 55% in March, XLE has likely been the quarter's standout performer. Watch whether it can hold gains if oil pulls back on any Iran ceasefire talk.
- GLD (SPDR Gold ETF): Gold's safe-haven bid should remain supported. Key support at the ETF equivalent of $4,500/oz spot. A break below would trigger stop-loss selling from momentum players.
- QQQ (Nasdaq-100 ETF): Most exposed to rate-driven multiple compression. If Consumer Confidence misses and rate cut odds rise, QQQ could see a relief bounce. If the data is strong, the "higher for longer" narrative keeps the pressure on.
- SPY (S&P 500 ETF): Five consecutive weekly losses. Technical support around the 200-day moving average is being tested. Quarter-end rebalancing could add volatility in both directions Tuesday morning.
- VIX: Elevated throughout the Iran conflict. A spike above 25 would signal the market is starting to price in a broader ground war or Kharg Island seizure. Watch VIX more than price action for directional signals.
- OXY, CVX, XOM: Individual energy names with direct Iran exposure. Trump's "take the oil" comments are being watched closely in context of U.S. energy policy. Any indication of controlled Iranian oil resuming supply would crush these names.
Key Levels and Overnight Watch
BTC: Critical hold at $66,000. Bear flag target $46,000 if this breaks on daily close. Recovery above $68,500 would negate the pattern and open $72,000.
ETH: Trading at $2,028 (+1.64%). Relative strength vs BTC is notable. Hold above $2,000 keeps the $2,200-$2,400 range target alive.
Gold: $4,500 floor, $4,577 resistance. Direction set by overnight Iran war headlines.
Brent Oil: $112.72 current. Societe Generale's $150/barrel April target is the tail risk. Key: any Trump-Iran back-channel diplomatic signals that emerge overnight could flush $10-15 from this price fast.
S&P 500: Fifth consecutive losing week on the books. Quarter-end rebalancing tomorrow morning creates a binary setup - watch the first 30 minutes after the 13:30 UTC open for direction.
The through-line for every market tonight is the same: the Iran war narrative controls everything. Oil controls inflation. Inflation controls rate expectations. Rate expectations control equities and crypto. Any development at the Bab el-Mandeb Strait, Kharg Island, or in back-channel Iran-U.S. diplomacy will move all of them simultaneously. Stay positioned for volatility in both directions.