Guess the timeframe. Below is a Bitcoin chart with the label hidden. It could be 5 minutes per candle, or a full day per candle. Take a second and pick one before you scroll.
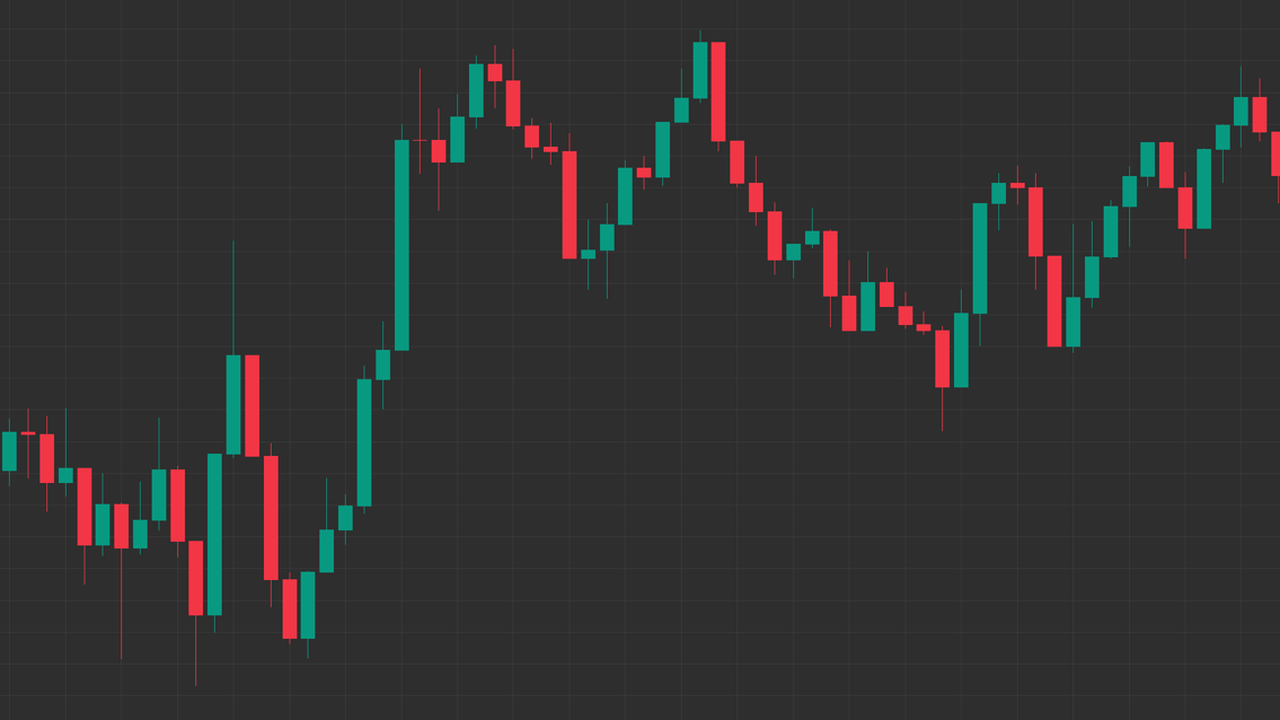
If you weren't sure, you're not alone. Most people can't tell a 5 minute chart from a daily one, and that tells you a lot about how charts work. Let's start with the building block every chart is made of.
What a candle actually shows
Each candle covers one slice of time and records four prices from that slice:
- Open: the price when the slice started.
- High: the highest price reached during the slice.
- Low: the lowest price reached during the slice.
- Close: the price when the slice ended.
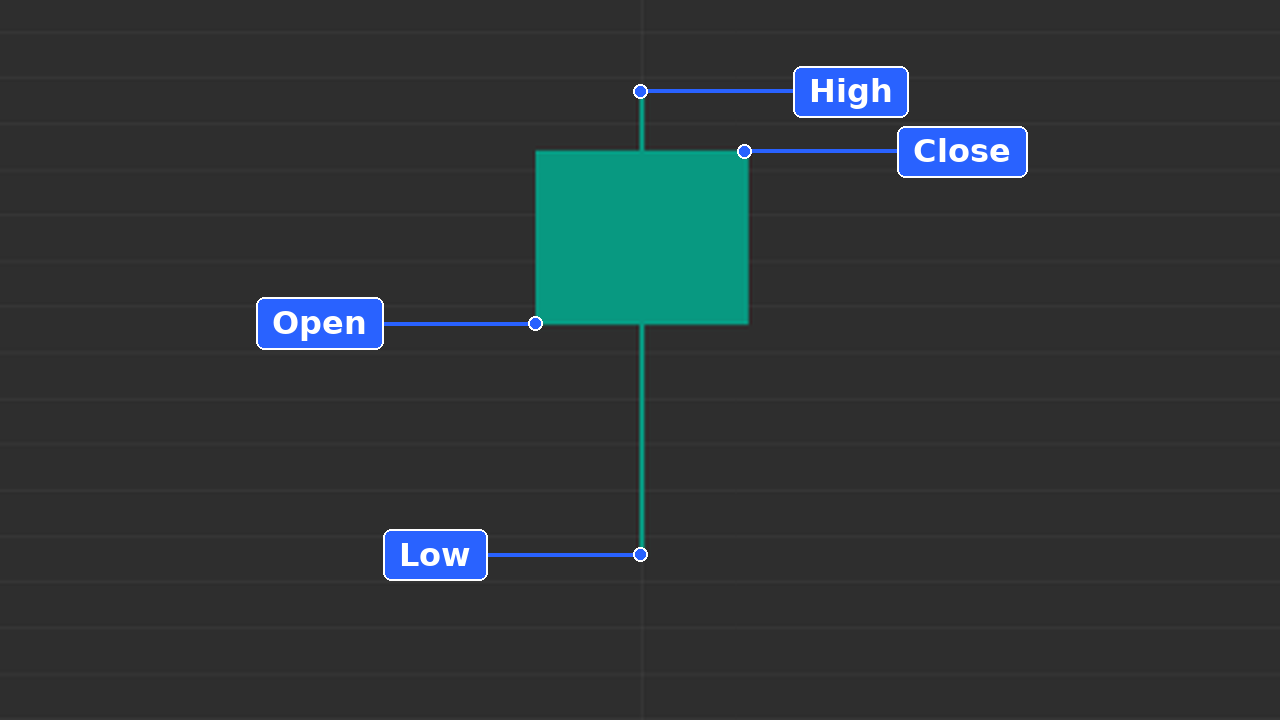
The thick part (the body) runs between the open and the close. The thin lines (the wicks) show how far price stretched above and below before it settled. If the close is above the open, the candle is usually green; if it's below, usually red. Long wicks show price was pushed away from a level, so buyers or sellers stepped in there. Colours can be changed in any charting app, so read the open and close, not just the colour. For a deeper walkthrough of candles and bars, see our guide on how to read a price chart.
What a timeframe is
The timeframe is simply how much time each candle covers. On a 5 minute chart, every candle is 5 minutes of trading. On a daily chart, every candle is a full day. Same market, same price history, just sliced into different-sized pieces. A daily candle contains everything that happened across all the 5 minute candles of that day, squeezed into one.
Why a 5 minute chart and a daily chart can look the same
Here's the reveal from the top of this lesson.
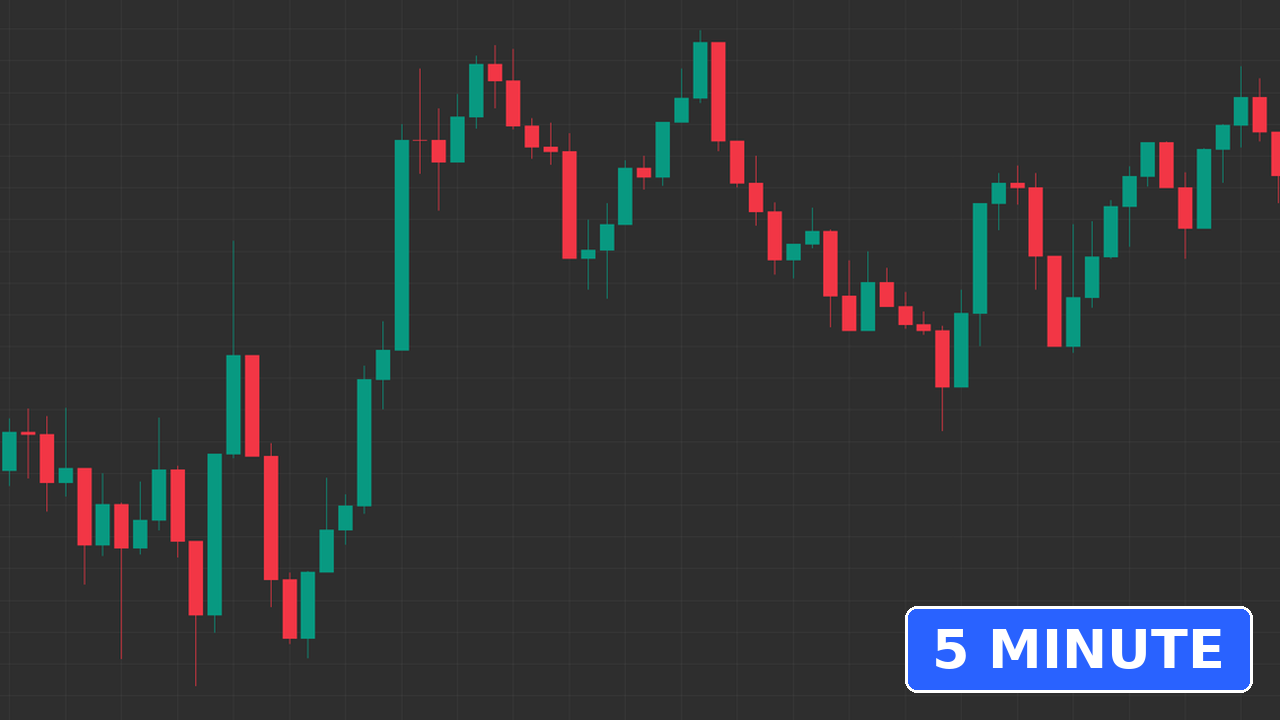
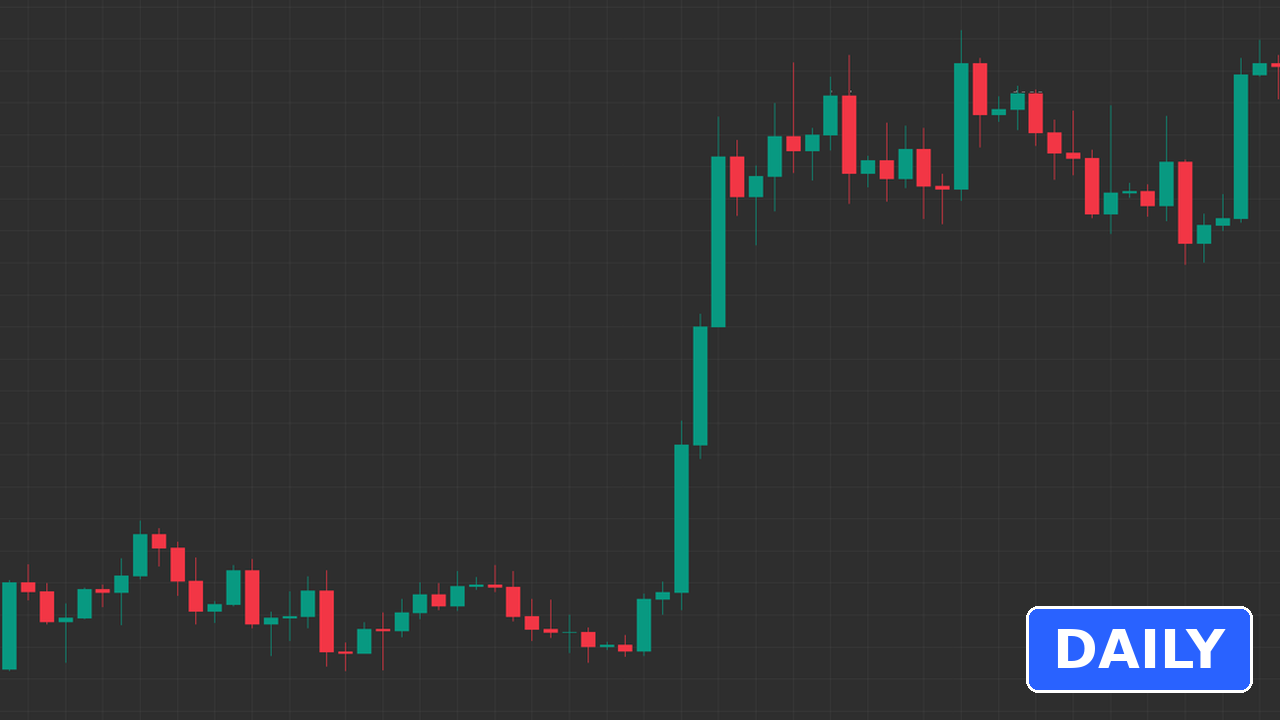
The answer: Chart A, the one from the top of this lesson, is the 5 minute chart. Chart B is the daily.
Both show a trend, then a pullback, then a push. That's because markets tend to make similar shapes at every scale. Traders call this fractal behaviour: zoom in or zoom out, and you still see trends, pullbacks and ranges. That's useful, because a method you understand on one timeframe can be practised on another. When timeframes disagree, the higher one usually carries more weight. A daily trend matters more than a 5 minute wiggle against it.
But it's also a trap. A move that looks huge on a 5 minute chart might be a tiny wiggle on the daily. A pullback on the daily can last weeks. If you misread the timeframe, you misread the size of the move, how long it might take, and where a sensible stop would go. That links straight back to yesterday's lesson on self-inflicted mistakes: a stop sized for a daily chart on a 5 minute trade, or the other way round, is a sizing mistake waiting to happen.
Your beginner checklist: check the timeframe first
Before you read anything else on a chart, run through these:
- 1. What timeframe is this? Find the label (usually top left) before you look at a single candle.
- 2. What market is this? Check the symbol, so you know what you're actually looking at.
- 3. What did the last candle do? Read its open, high, low and close.
- 4. What's the bigger picture? Zoom out at least one timeframe and see the bigger trend.
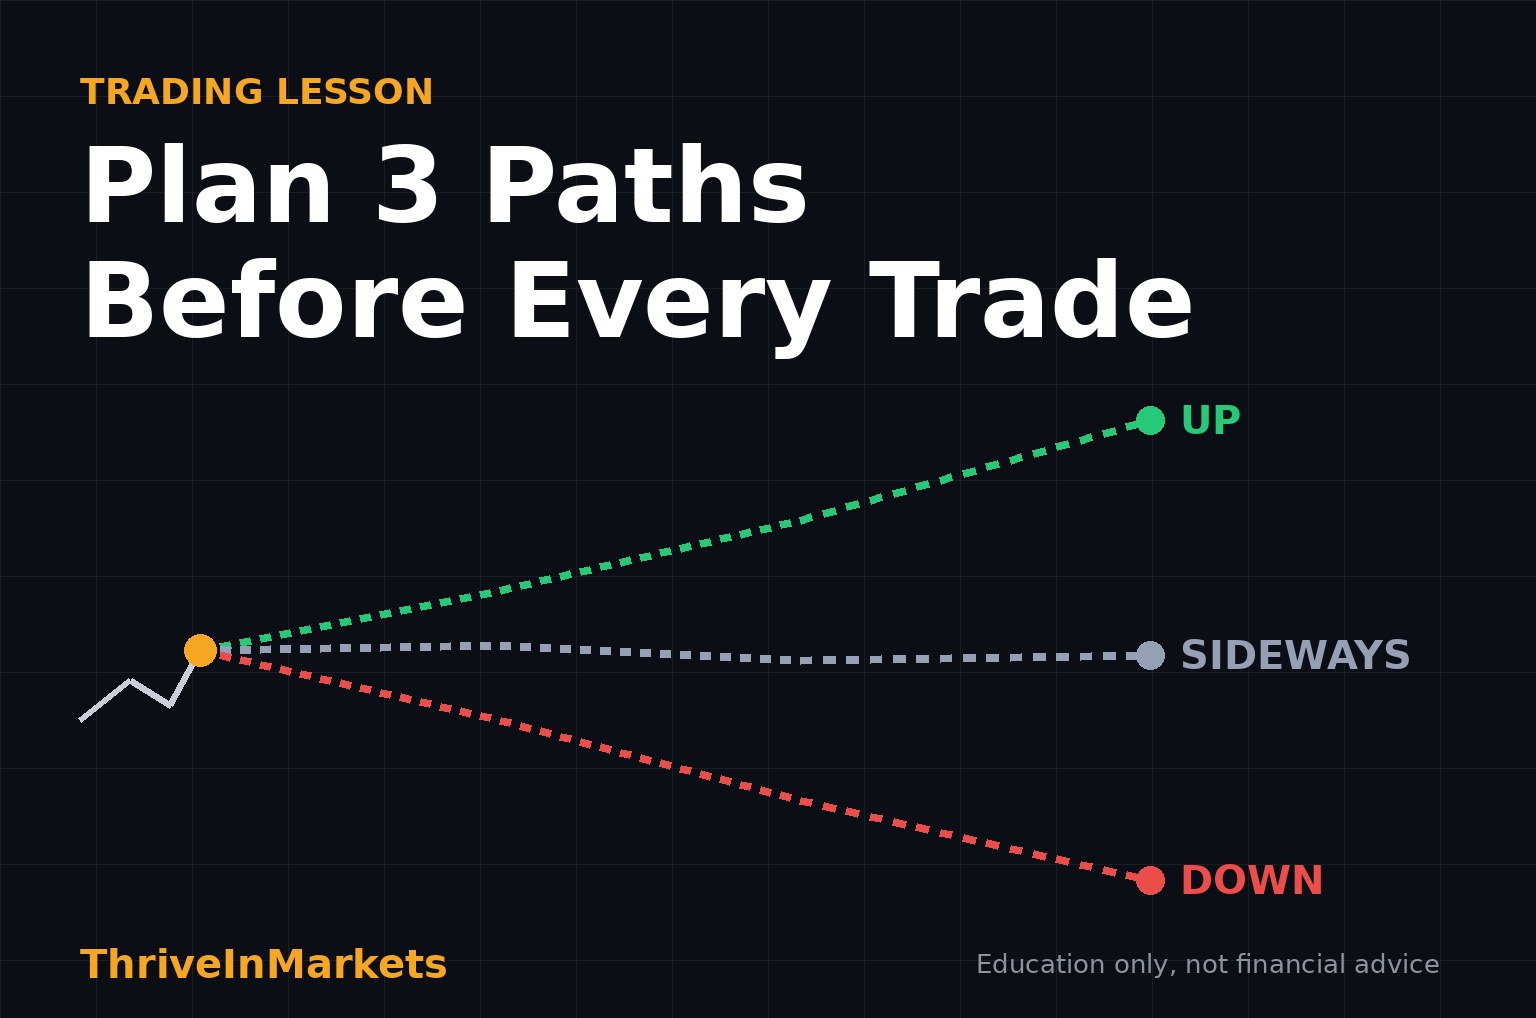
- 5. Does my plan match this timeframe? Your stop and size should fit the timeframe you trade, as in our lesson on planning 3 paths before every trade.
Practice it
Open any chart in TradingView (affiliate link), hide the timeframe label, and switch between 5 minute, 1 hour and daily. Try to guess each one before you look. Then use bar replay to step through candles one at a time and read the open, high, low and close of each. Our TradingView guide shows where these settings live.
Your challenge
Today, before you open any trade or idea, say the timeframe out loud. Then read the last three candles: open, high, low, close. Do this for a week and checking the timeframe first will become a habit.
This article is for education only and isn't financial advice. Trading involves risk, and you can lose money.