The indicator said sell. Price kept going up. If that's happened to you, you're not alone. It's one of the most common beginner mistakes, and I made it plenty of times myself.
1. What "overbought" actually means
RSI is a line that moves between 0 and 100. It measures strength and momentum, how hard price has been pushing lately. Above 70, people call it "overbought". That's useful info. It just isn't a sell button on its own.
Think of it like a speedometer. It tells you the car is going fast. It doesn't tell you the car is about to brake.
2. Strong trends can stay overbought
Here's a real example, just as an illustration. On the BTC daily chart, RSI crossed above 70 on 19 Aug 2026 with price around 69.3k.
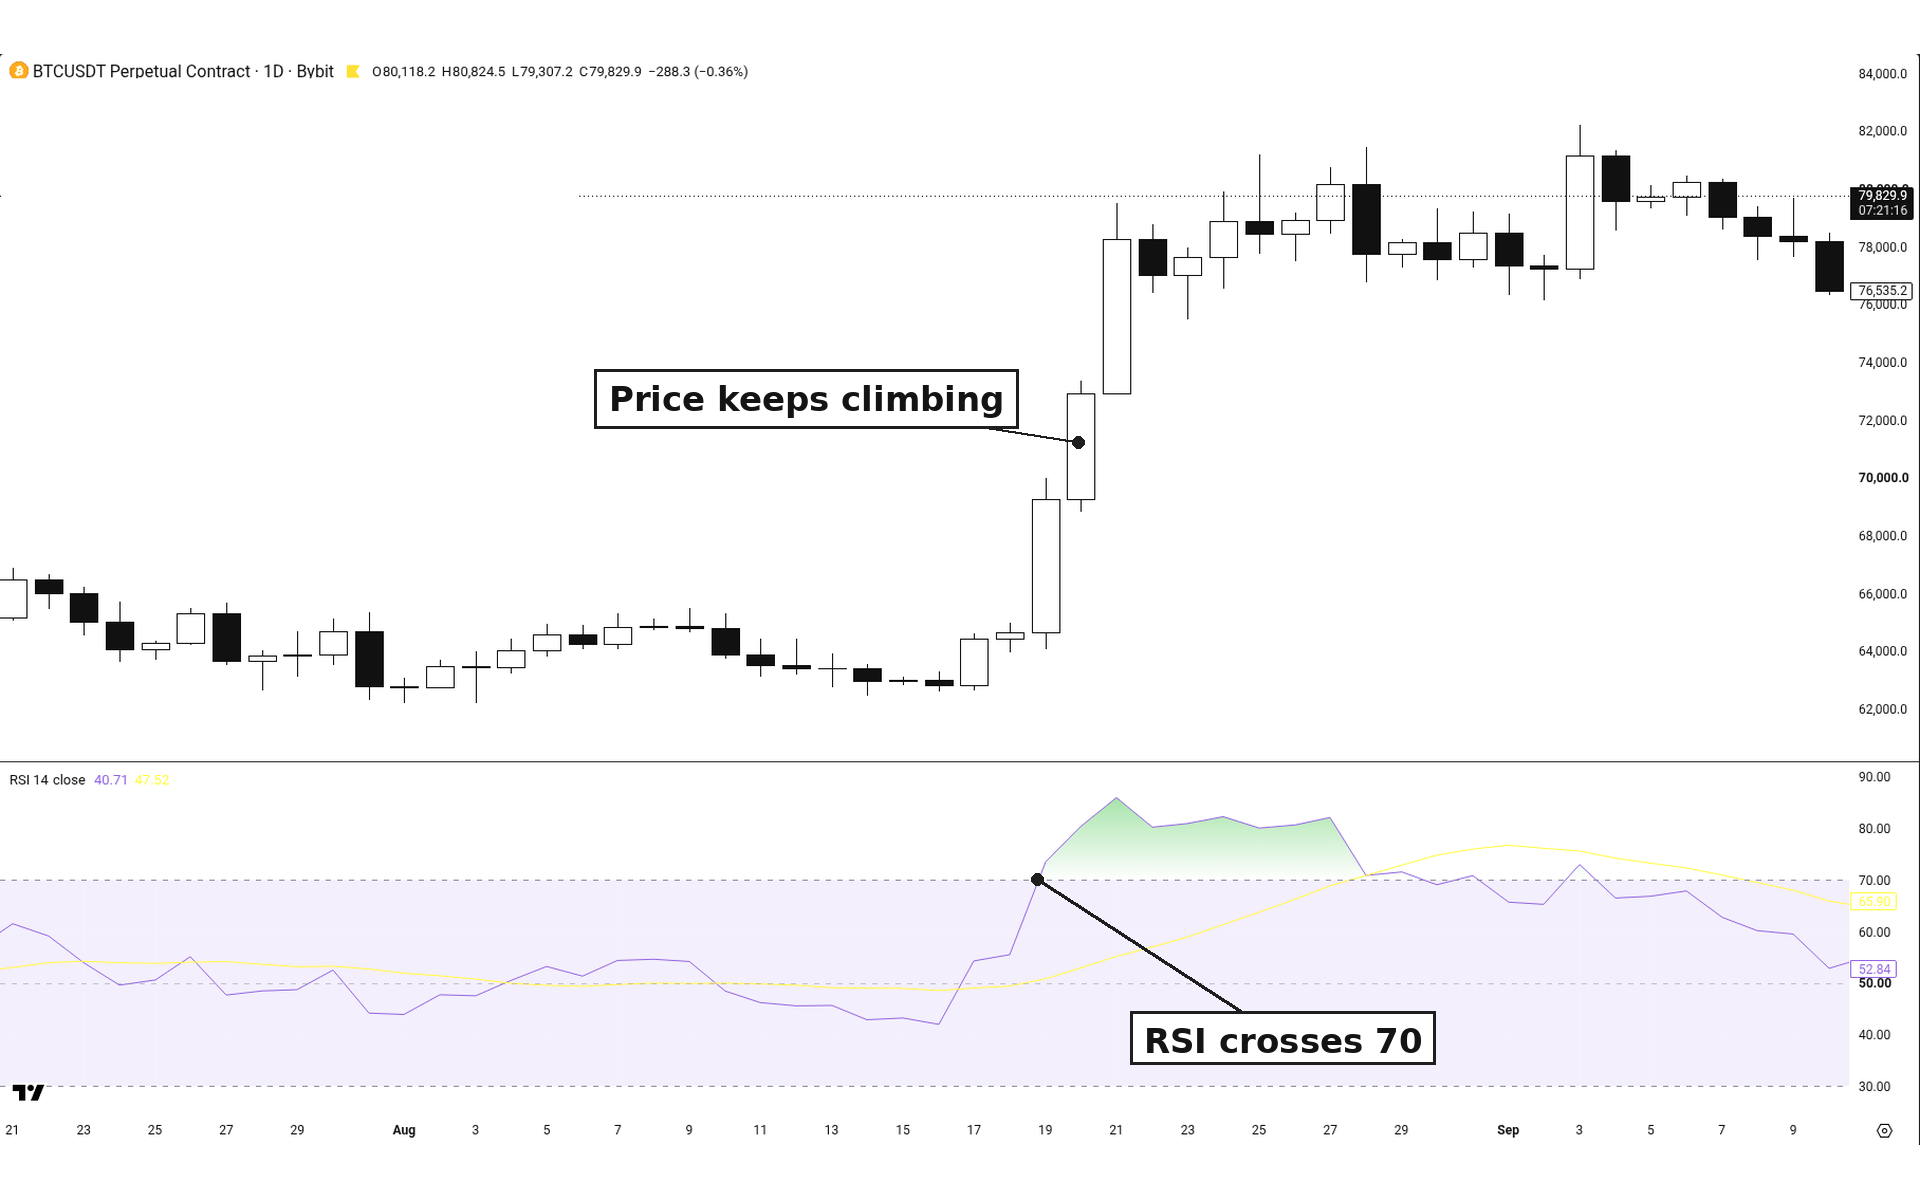
If you sold just because RSI said "overbought", you'd have been fighting the trend. Price kept climbing and reached about 87.4k by 21 Sep.
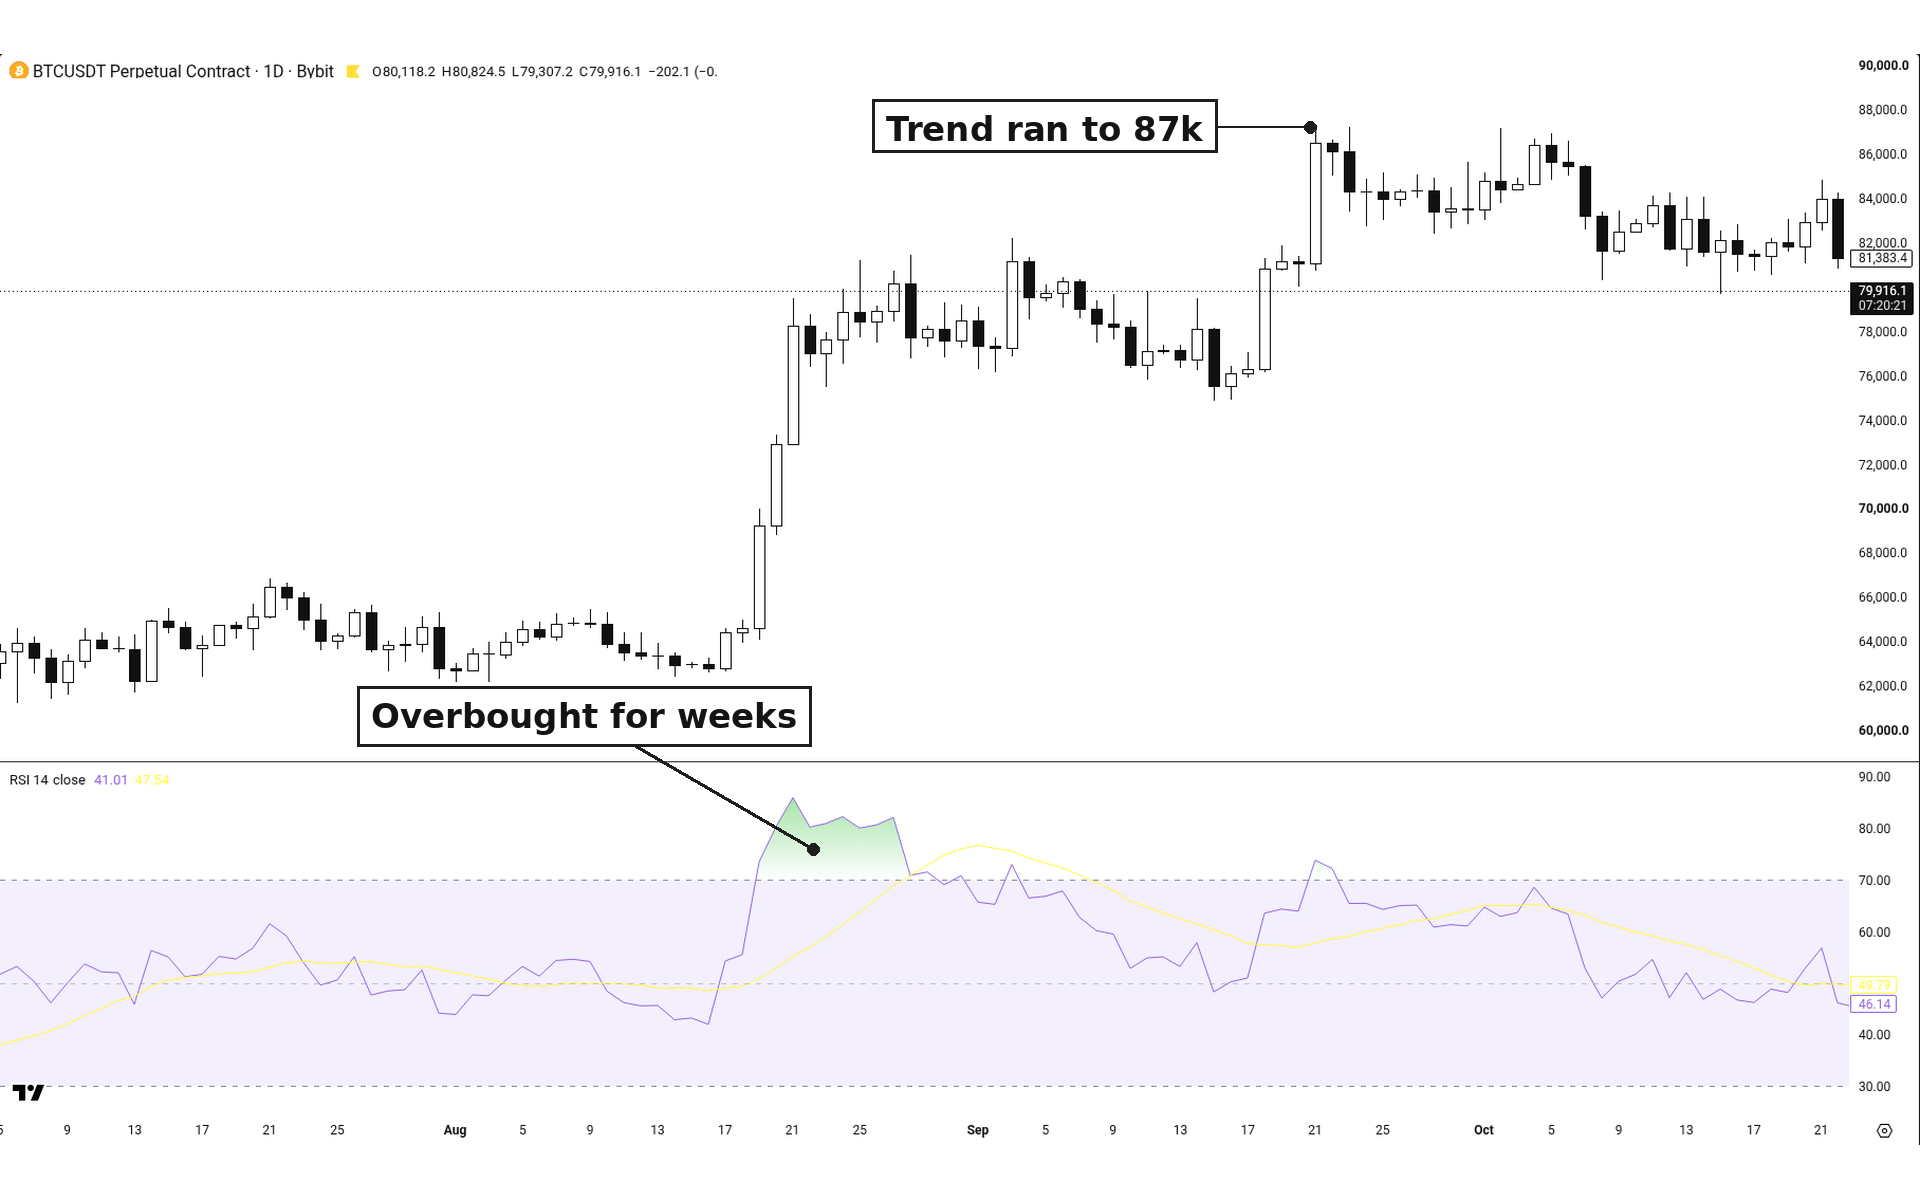
Overbought means strong, not finished.
3. Read structure first
Before you look at any indicator, ask the chart:
- Is price still making higher highs and higher lows?
- Has it lost a level it was respecting?
- Are the candles getting weaker, or still strong?
If structure is still going up, the trend is up. We covered the basics in Reading Your First Chart.
4. When overbought starts to matter
Overbought gets interesting when two things show up together:
- Bearish divergence: price makes a higher high, but RSI makes a lower high. Price went up, but with less push behind it.
- A structure break: price makes a lower high, or breaks below the last higher low.
Divergence alone can show up a few candles before anything happens, or price can just keep going. So wait for the break. Let price confirm it.
5. Check the bigger timeframe
If the daily or weekly RSI is above 70 and momentum is fading, that's a reason to protect the longs you already have, like tightening your stop or taking some off. It's not a reason to jump into a short straight away.
6. The same goes for oversold
RSI below 30 in a downtrend isn't a buy signal either. Falling markets can stay oversold for a long time. Wait for structure to turn first.
7. RSI confirms, it doesn't decide
Indicators are built from price, so they always lag a little. Price is real-time. Use RSI as a second opinion that backs up what the chart already shows.
You can add RSI to any chart for free on TradingView (affiliate link). Practise reading structure first, then check what RSI says.
Today's takeaway
- Overbought means strong, not finished.
- Read structure first: higher highs and higher lows.
- RSI confirms, it doesn't decide.
- Wait for the break.
- Indicators lag, price is real-time. Let price lead.
Educational only, not financial advice. Trading involves risk of loss. No profits are promised. The TradingView link is an affiliate link.
← Previous lesson: How to Learn Trading Without Burning Your Account · Next lesson: see the full series →