Open any chart, on any market, on any timeframe. Whatever it looks like, it's usually doing one of four things. Once you can name which one, a messy chart gets a lot calmer to read.
1. The four phases
- Accumulation (sideways at the bottom): price goes back and forth after a long fall. Buyers often (not always) build positions quietly here.
- Markup (up): price leaves the range and makes higher highs and higher lows.
- Distribution (sideways at the top): after a long rise, the push runs out of steam and price chops around. Often this is where earlier buyers cash out.
- Markdown (down): price breaks lower and makes lower highs and lower lows.
2. A real full cycle on Bitcoin
Here's one real example from this year, on the BTC daily chart, just as an illustration:
- Accumulation (6 Feb - 6 Apr 2026): after a sharp drop to about 59.8k on 6 Feb, price spent two months going sideways, mostly between roughly 62k and 74k, with one spike to about 76.0k on 17 Mar that didn't hold.
- Markup (7 Apr - 6 May 2026): price climbed from about 67.7k to about 82.8k, with each dip holding higher than the last (about 70.4k on 9 Apr, 73.3k on 16 Apr, 74.9k on 29 Apr).
- Distribution (6 May - 26 May 2026): price stalled between about 82.8k and 74.2k. Notice the highs getting a bit lower each time: about 82.5k on 10 May, 82.0k on 14 May, 78.2k on 21 May.
- Markdown (27 May - 5 Jun 2026): price broke lower, from about 76.2k to about 59.1k in under ten days.
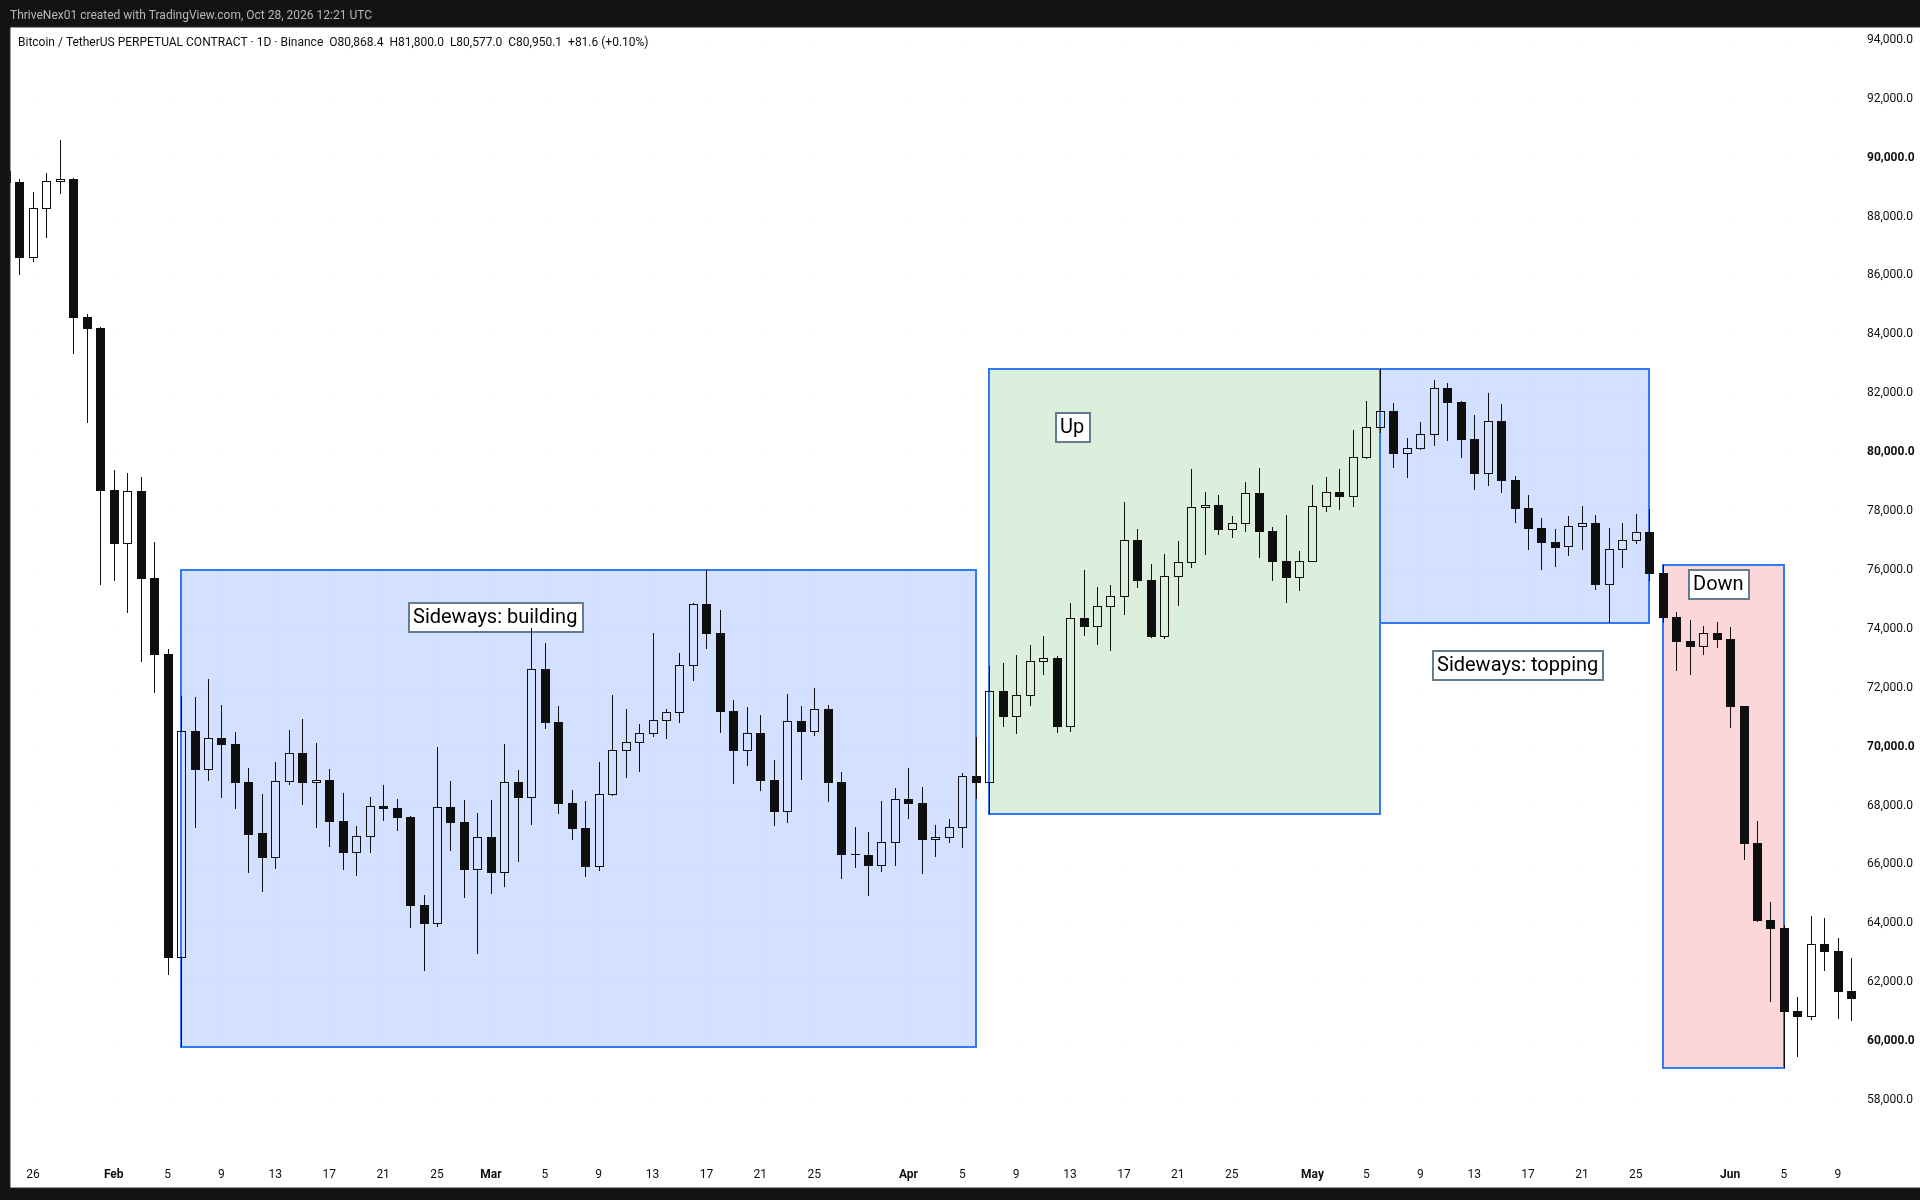
Look at the end of it: price came almost all the way back to where the cycle started. That's why naming the phase matters. Buying the "up" feeling in the middle of the distribution box would have felt very different from buying in the accumulation box.
3. Phases sit inside each other
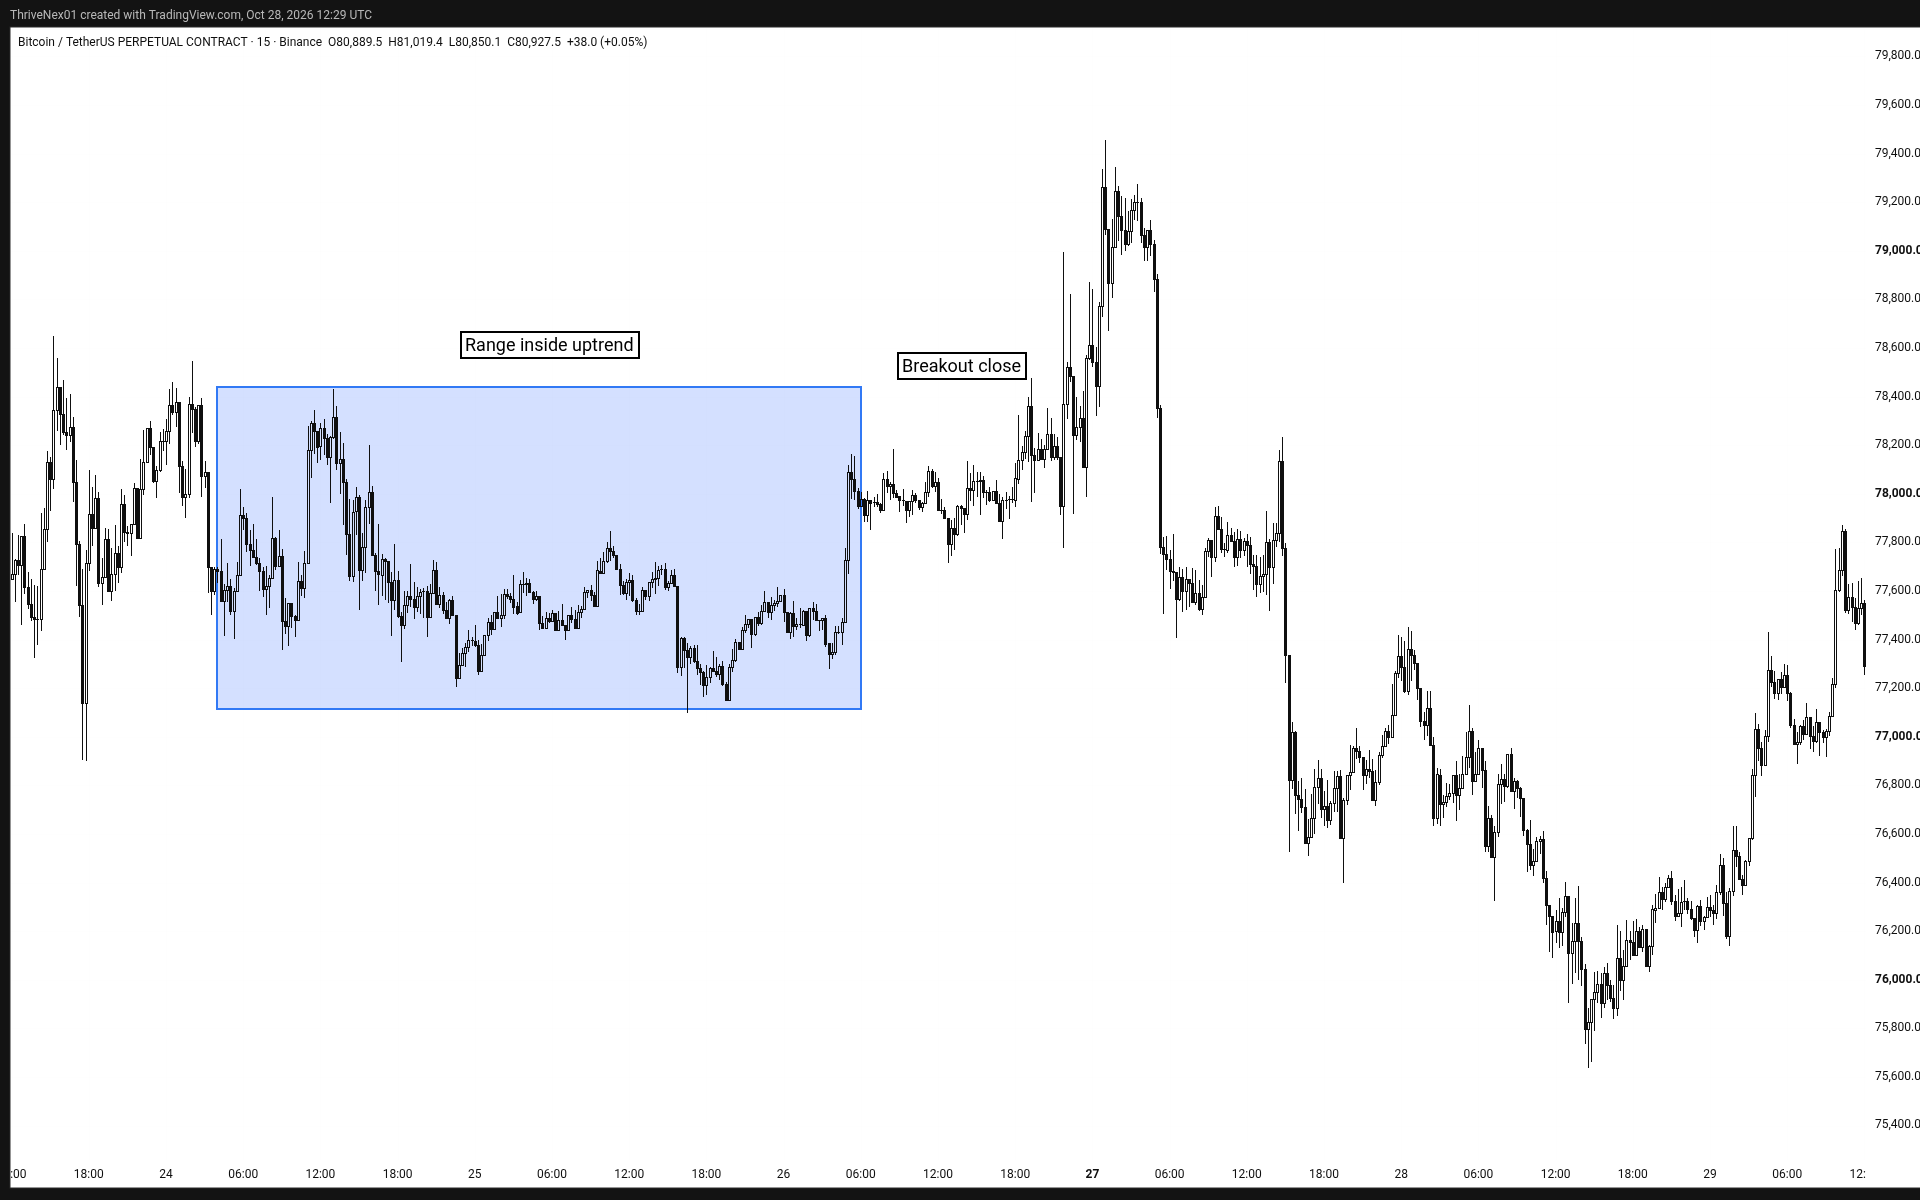
Every timeframe has its own phase. A daily uptrend can hold a 15-minute range, and that range can hold its own little downtrend. They're all true at once.
A real example: on the daily chart, BTC was in the markup phase above (April 2026). But on the 15-minute chart, from about 04:00 UTC on 24 Apr to 06:00 UTC on 26 Apr, price just went sideways between roughly 77.1k and 78.4k for two days.
Size matters, though. An accumulation or distribution range on a big timeframe, lasting weeks to months, means far more than a range of a few days on a small chart, which can just be noise. The bigger the range, the bigger the move that tends to follow it.
4. When both timeframes agree
The cleaner spots often (not always) come when the big picture and the small picture point the same way. Daily going up, and the 15-minute range breaking up, means both are agreeing.
In that example, the first 15-minute candle to close above the range came at 22:00 UTC on 26 Apr (close about 78.5k). The daily chart went on to reach about 79.5k on 27 Apr.
5. A range can break either way
Phases don't always come in a neat order. A sideways range in an uptrend can turn into a top instead of a pause. Even in our example, after 27 Apr price dipped to about 74.9k on 29 Apr before it pushed on to about 82.8k on 6 May. If you'd been in, you'd have needed a stop with real room, or you'd have been out. So treat the range as a question, not an answer, and let the break tell you.
6. Questions to ask before any trade
- Which of the four phases is the higher timeframe in?
- Which phase is my trading timeframe in?
- Do they agree, or am I fighting the bigger picture?
- If this range breaks the wrong way, where am I out?
This builds on Day 6, Stop Predicting, Start Reading the Path, Day 5, Why Price Action Comes First, and our guide on how to read a price chart.
You can practise boxing up the four phases on any past chart for free on TradingView (affiliate link). Scroll back, hide the right side, name the phase, then check what happened.
Today's takeaway
- Every chart is in accumulation, markup, distribution, or markdown.
- Each timeframe has its own phase, nested inside the bigger one.
- Better setups often come when the big and small charts agree.
- A range can break either way, so plan for both.
- Before any trade, name the phase.
Educational only, not financial advice. Trading involves risk of loss. No profits are promised. Chart levels are approximate, from Binance BTCUSDT perpetual futures daily and 15-minute candles (UTC). The TradingView link is an affiliate link.
← Previous lesson: Stop Predicting, Start Reading the Path · Next lesson: see the full series →