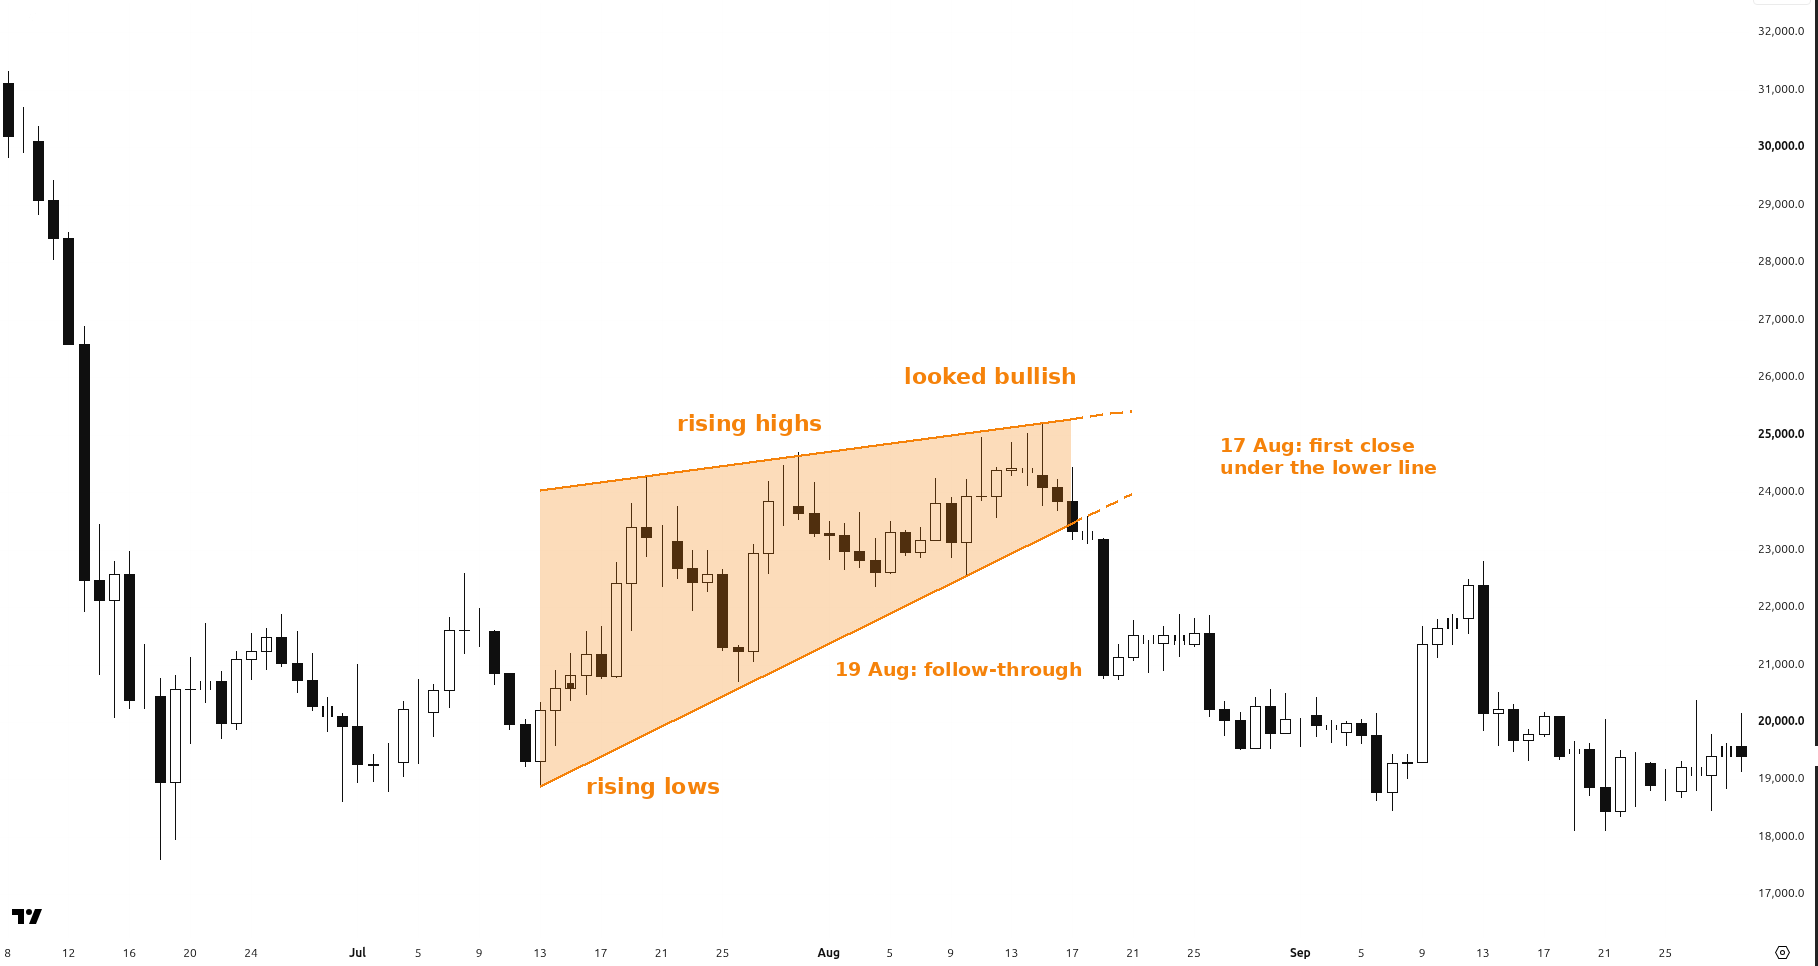
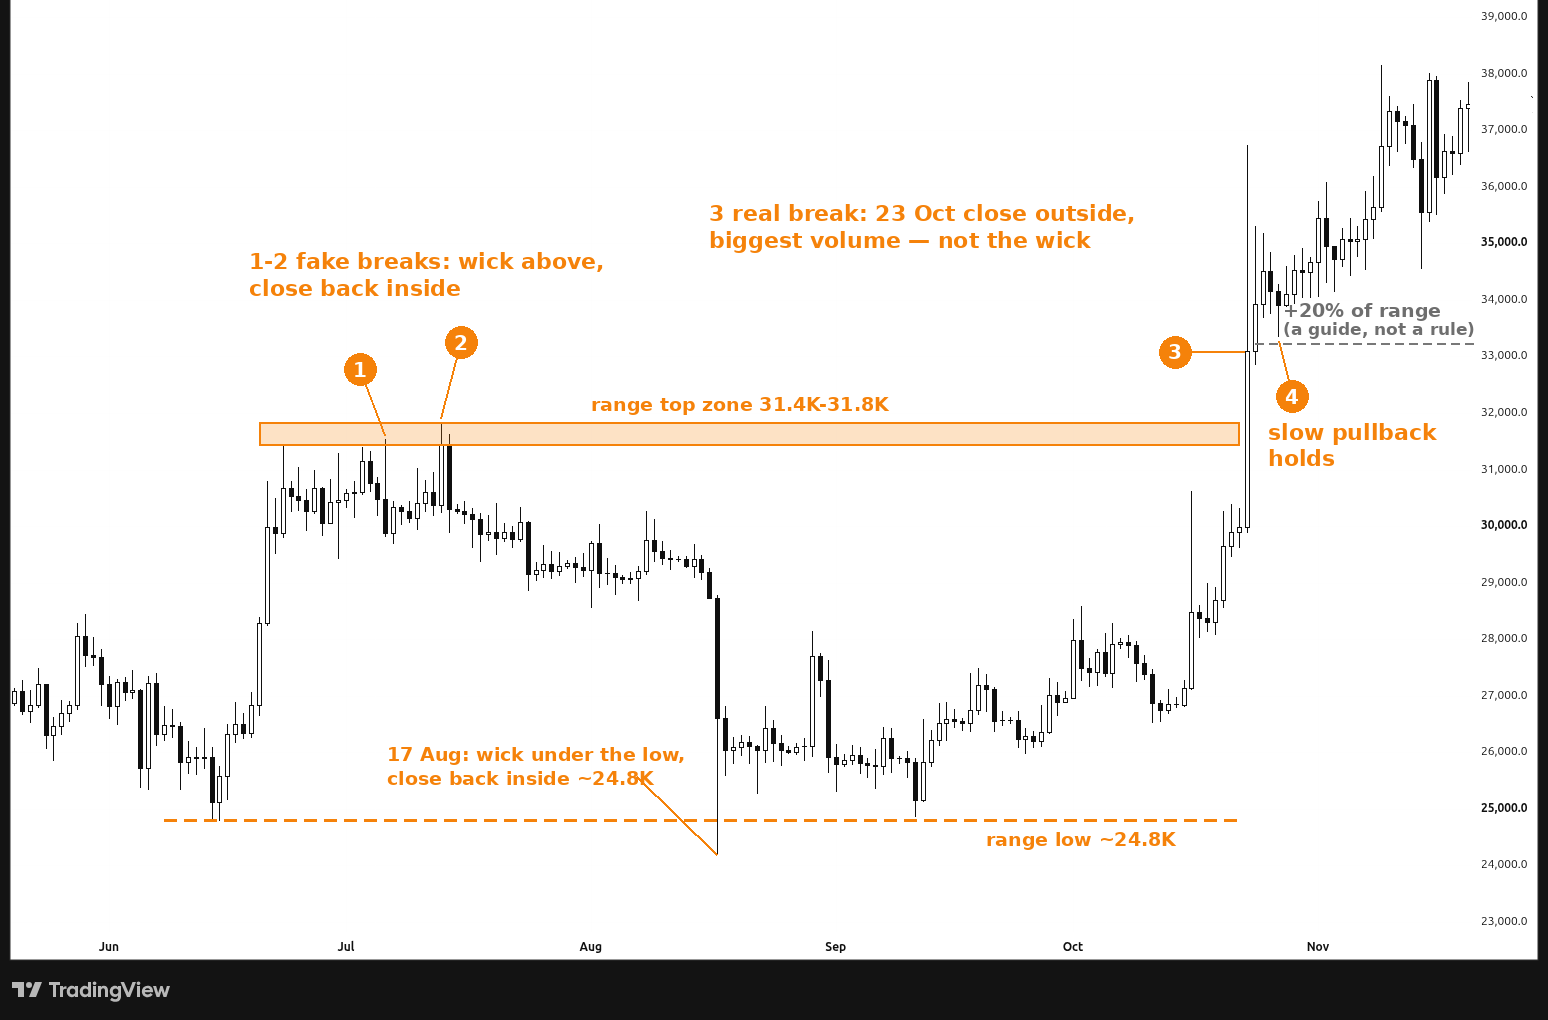
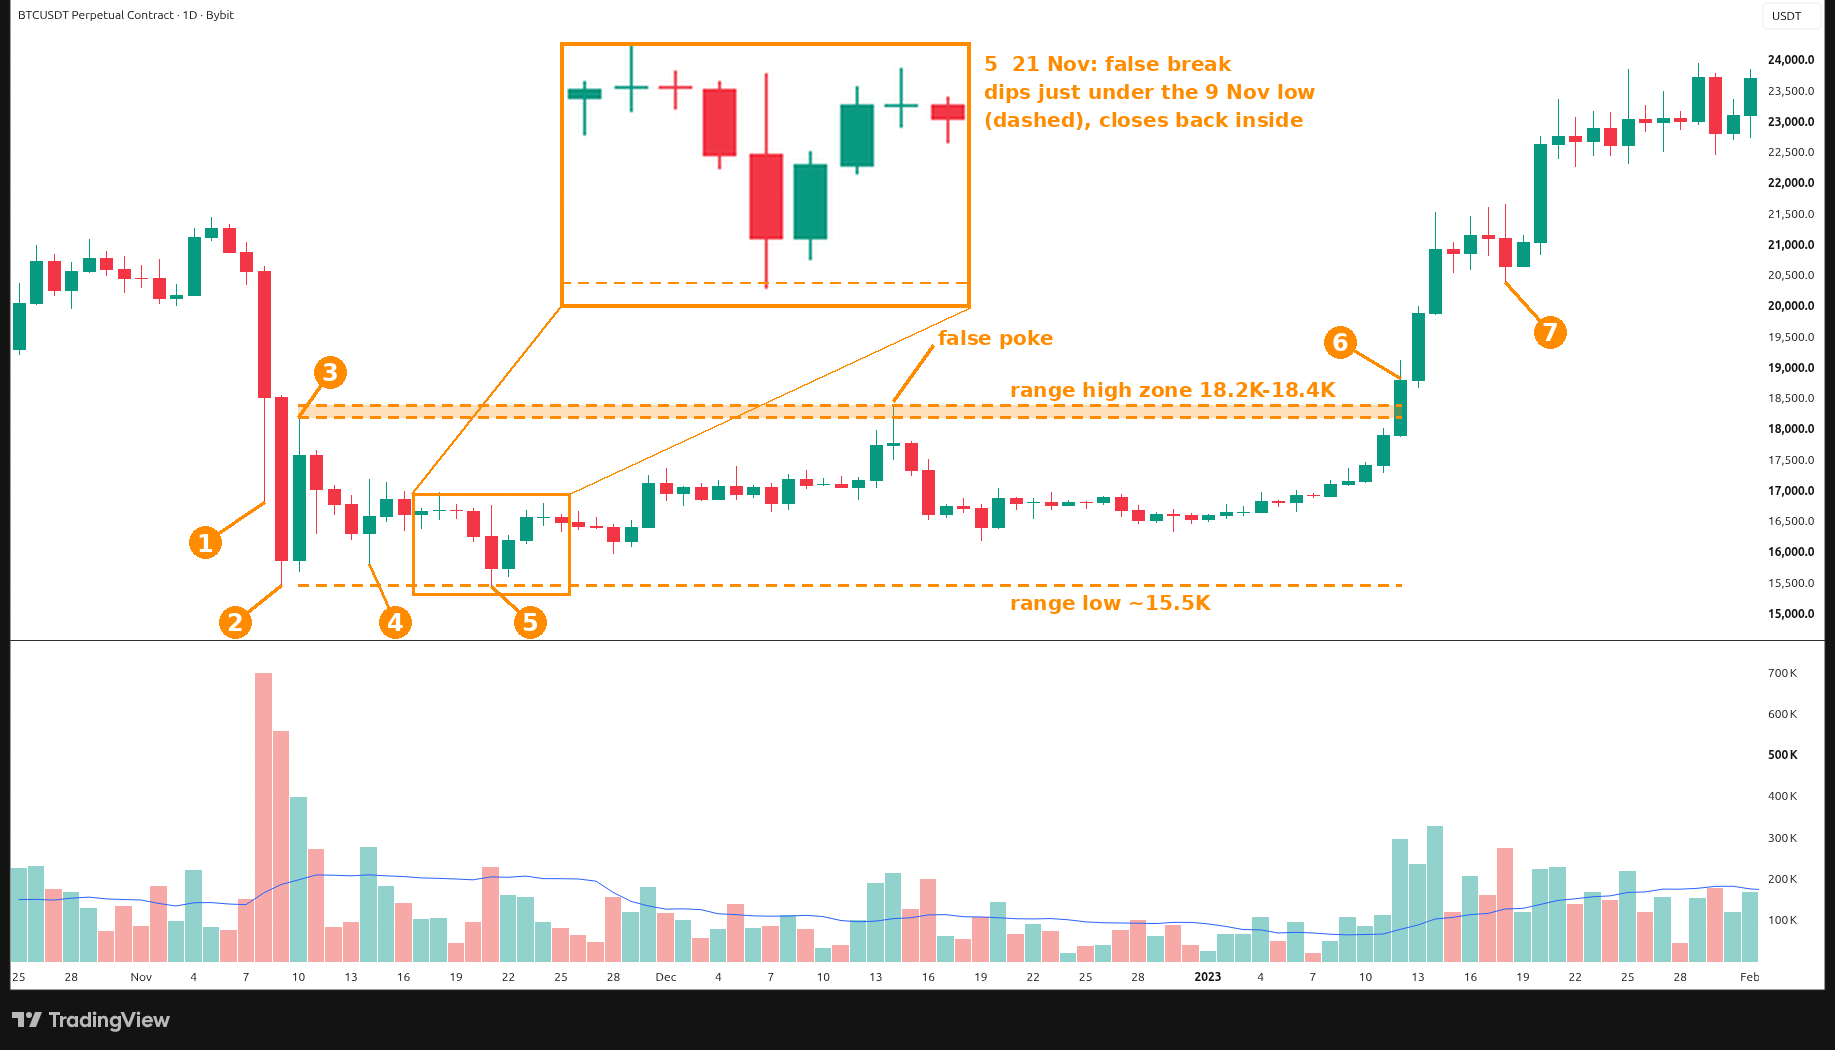
Draw levels from closes, not wicks.
In Day 22 we used the close, not the wick, to tell a real breakout from a poke. In Day 23 we drew the range we actually saw, even when it sloped. Today is about the lines themselves: where do you mark support and resistance in the first place?
These are tendencies, not a rule. A level is a zone, not a magic price. But a few simple habits keep the lines honest.
1. Mark what the closes show
Start on a higher timeframe, then work down: monthly, weekly, daily. Draw from candle closes, not from the wick that poked furthest. A wick is a probe. The close is where that session, or that week, actually finished.
Stronger levels often have a close followed by a real move away, or several closes in the same area. And the obvious ones matter more than a clever line only you can see. If other traders can spot it too, that is usually the point.
2. A real example: Bitcoin at 100,000 in 2025
On the Bybit BTCUSDT perpetual daily chart, 100,000 is about as obvious as a level gets.
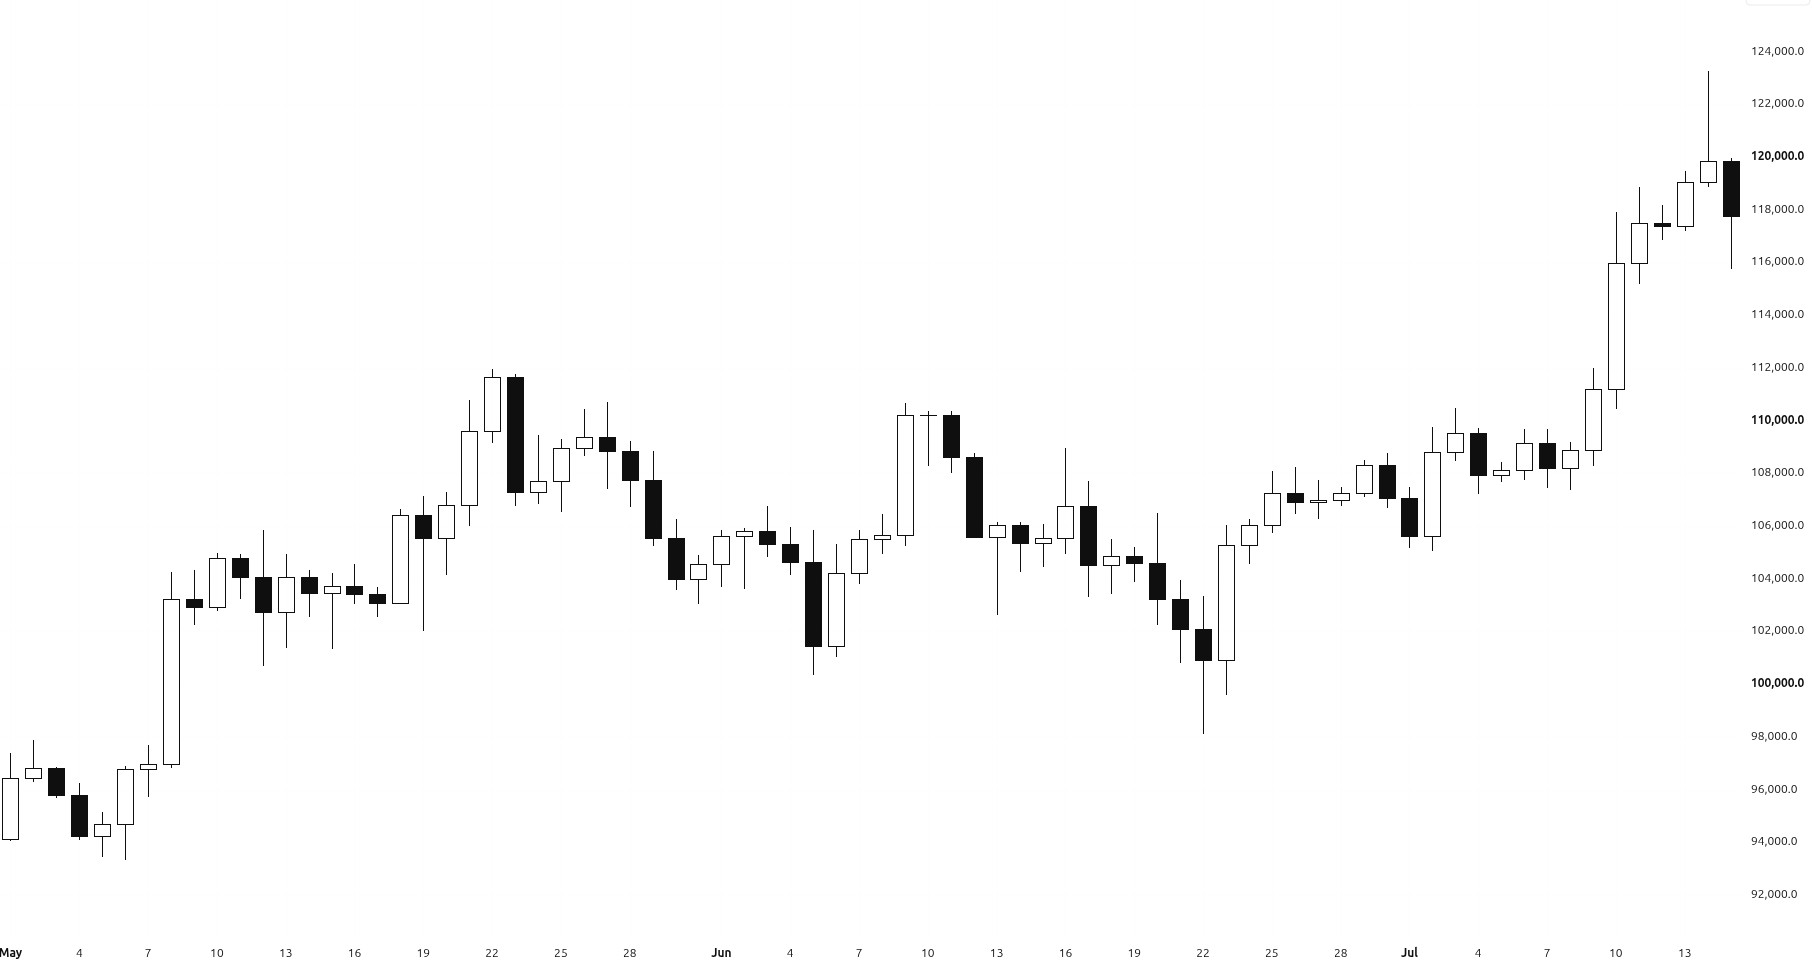
BTCUSDT perpetual, daily, Bybit. The clean view: a close back above 100,000 in early May 2025, a dip in June, then a hold and a push higher into July.
Here are the same candles with the 100,000 level marked from closes, not from the June wick.
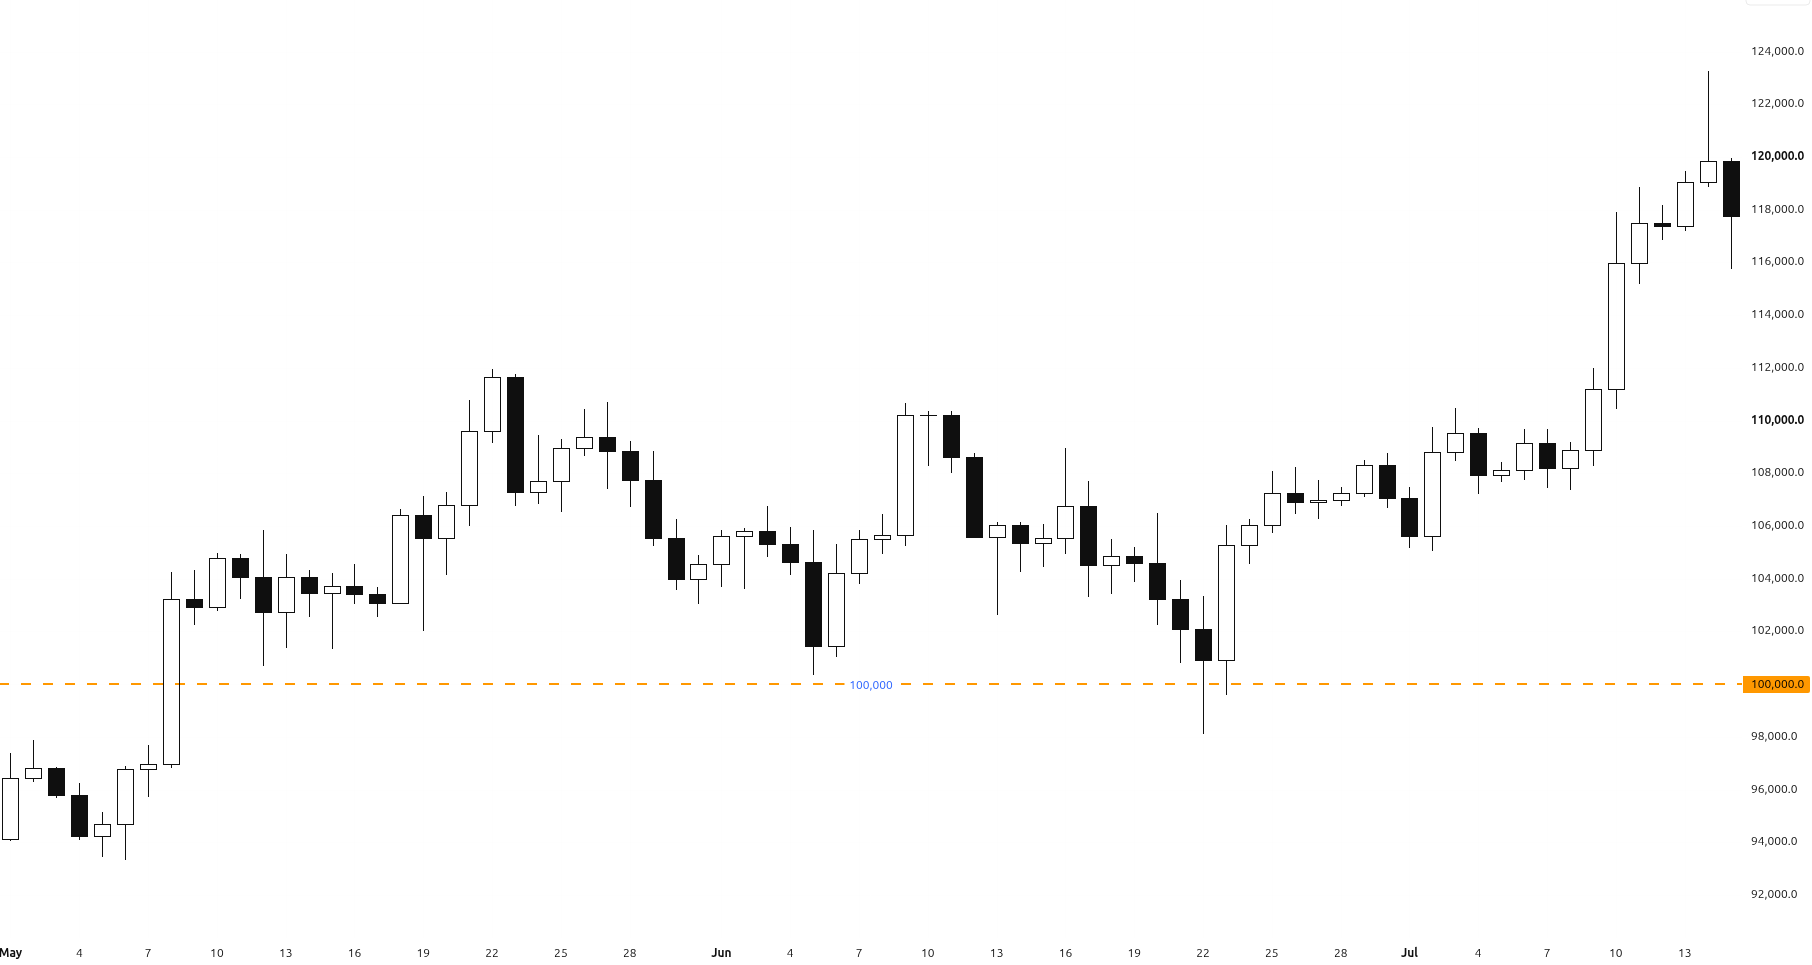
BTCUSDT perpetual, daily, Bybit. The week of 5 May 2025 was the first weekly close back above 100,000 since January: it opened at 94,224.1, still below the level, and closed at 104,080.0. The first daily close back above 100,000 since early February was 8 May, at 103,240.0.
The wick ran under. The close held.
In June the level was tested from above. On 22 June 2025, a Sunday and the last day of the Monday-start UTC week of 16 June, Bitcoin wicked down to 98,125.0, about 1,875 under 100,000, then closed at 100,904.3, back above the line. That daily close was also the weekly close of 16 June; that week's low was the same 98,125.0. The next day, 23 June, wicked to 99,581.0 and closed at 105,283.5. The week of 23 June closed at 108,314.8.
If you had marked the level at the 98,125 wick, you would have been following a probe that did not hold. Don't mark the wick tip as the new level. Keep the 100,000 line. The closes stayed above 100,000. Wicks still matter as probes, and the wick still shows how far the dip ran.
3. A held wick is not a permanent floor
A close above after a poke is evidence for that session, or that week. It is not a promise the level will hold forever.
In early November 2025, daily candles wicked under 100,000 again on 4, 5 and 7 November, and still closed above it. On 13 November Bitcoin closed at 99,629.0, the first daily close back under 100,000 since the June tests. On 14 November it closed at 94,533.3. The week of 10 November closed at 94,215.9, the first weekly close back under the line.
The earlier wicks under 100,000 did not break the level. The close back under did.
4. Tests, and a few extra prices worth marking
The first touch of a fresh level can be the cleanest reaction, and a second touch can confirm that people are still defending it. After several tests, a level may weaken, and a close through it starts to matter more than one more wick. That is a tendency, not a countdown. This 100,000 example is not a "three tests, then it had to break" story: the June tests held, price ran much higher, and the close back under came months later.
It also helps to mark the daily, weekly and monthly opens. Those are prices many traders watch. They are extra context, not a substitute for the close.
Keep the last lessons in mind. Plan for more than one outcome, the way we did in Day 1: Plan 3 Paths Before Every Trade. A level can hold, or it can break. Draw it from the closes, then wait for the close to tell you which path you are on.
Draw levels from closes, not wicks.
← Previous: Day 23: Sloped Ranges: The Pattern Most Traders Miss · Next: Day 25 (coming soon) · Browse all daily lessons
Educational only, not financial advice. Trading involves risk of loss. No profits are promised.