A market bottom usually builds in seven steps.
In Day 20 we looked at how trends often end, either with a loud climax or with quiet exhaustion. After that ending, price does not always reverse in a straight line. It often goes sideways and builds a range. That range has a life cycle, and at a bottom it usually shows up as seven steps.
These are tendencies, not a rule. Real ranges are messy, and each step is a clue, not an entry signal.
1. The seven steps
A bottoming range often unfolds like this.
First comes a first stop, where buyers show up for the first time. Then a selling climax: one more panic flush to a new low, usually on heavy volume. After that, a sharp bounce, which often sets the top of the range.
Next is a slower retest of the low, usually on lighter volume. At that point control is neutral, not with the buyers yet. Later you may get a false break under the low that traps late sellers, then snaps back inside the range.
The real breakout is a push through the range high, often on rising volume. The last step is a pullback that holds, meaning the dip stays above the old range, or at least holds the breakout area.
Most of the time between the bounce and the breakout is chop.
2. A real bottom: Bitcoin, late 2022
You can see the whole sequence on Bitcoin after the 2022 decline. On the Bybit BTCUSDT perpetual daily chart, a range built from November 2022 into January 2023.
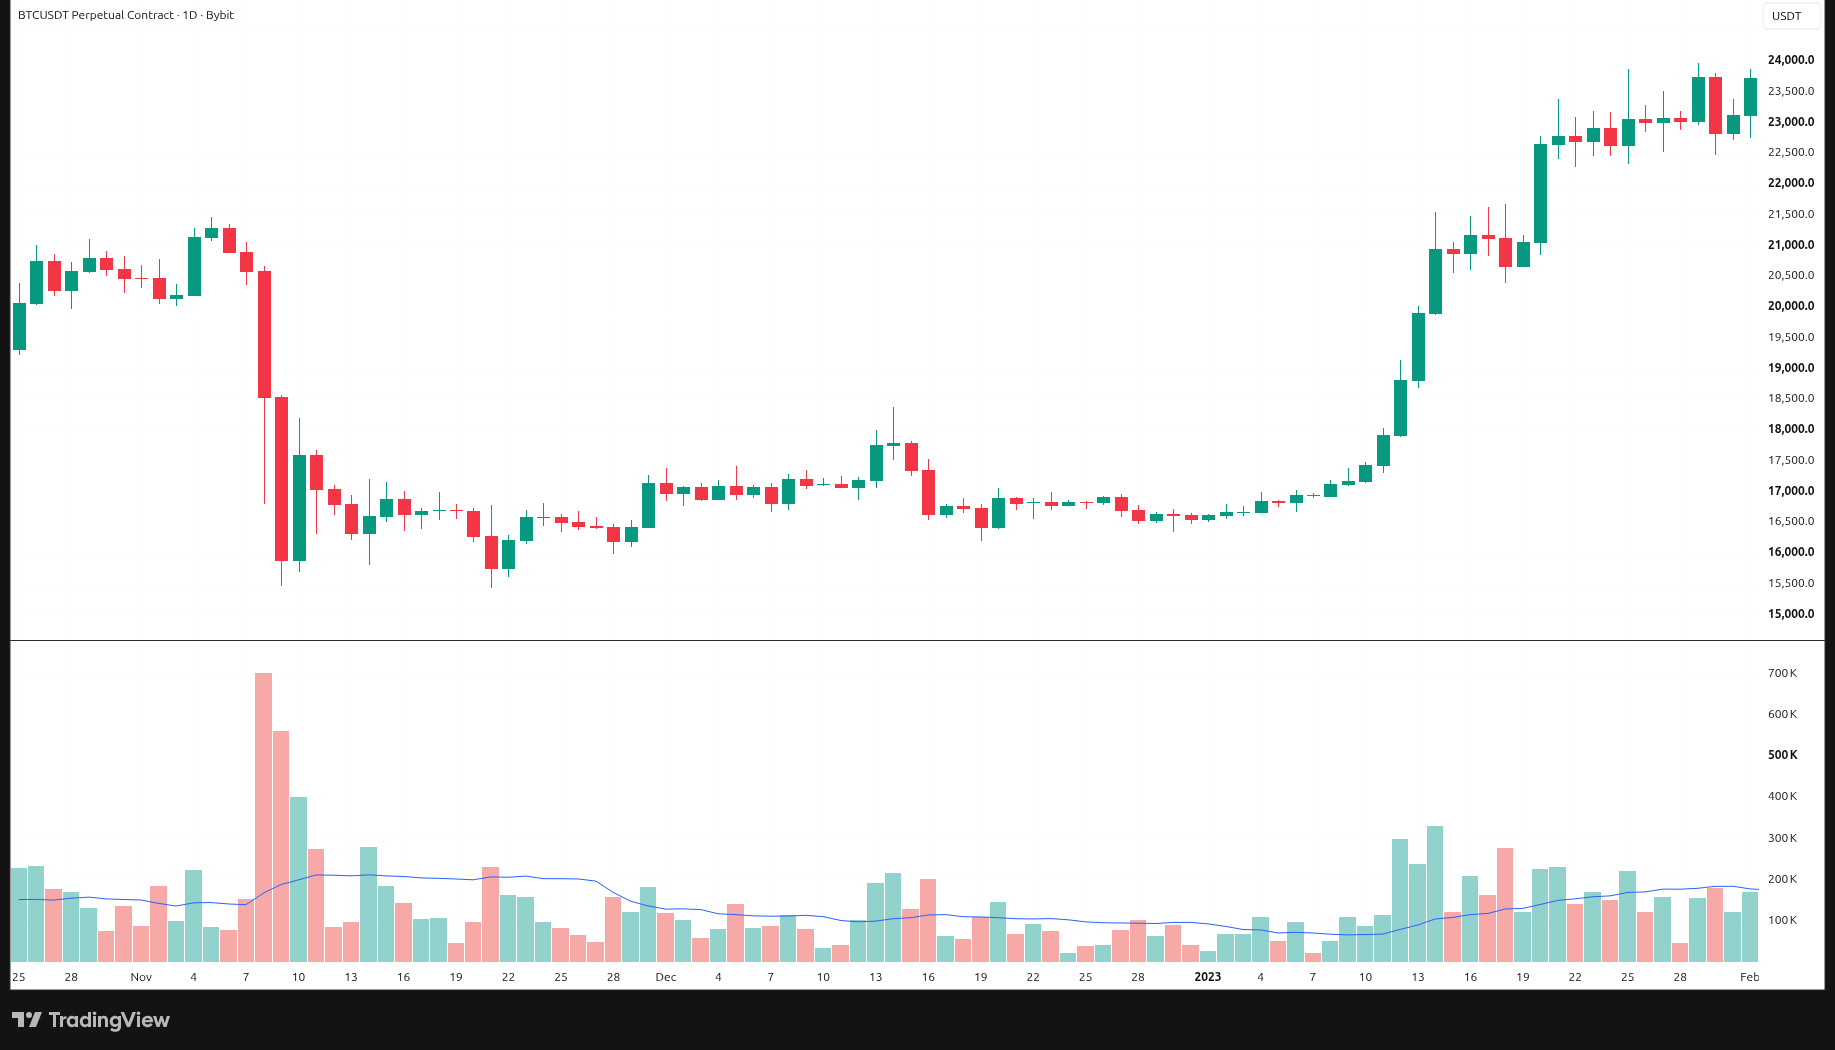
BTCUSDT perpetual, daily, Bybit. The clean view: a sharp sell-off in early November 2022, a messy range into early January, then a breakout and a pullback that stayed above the old range.
Here are the same candles, with the seven steps marked.
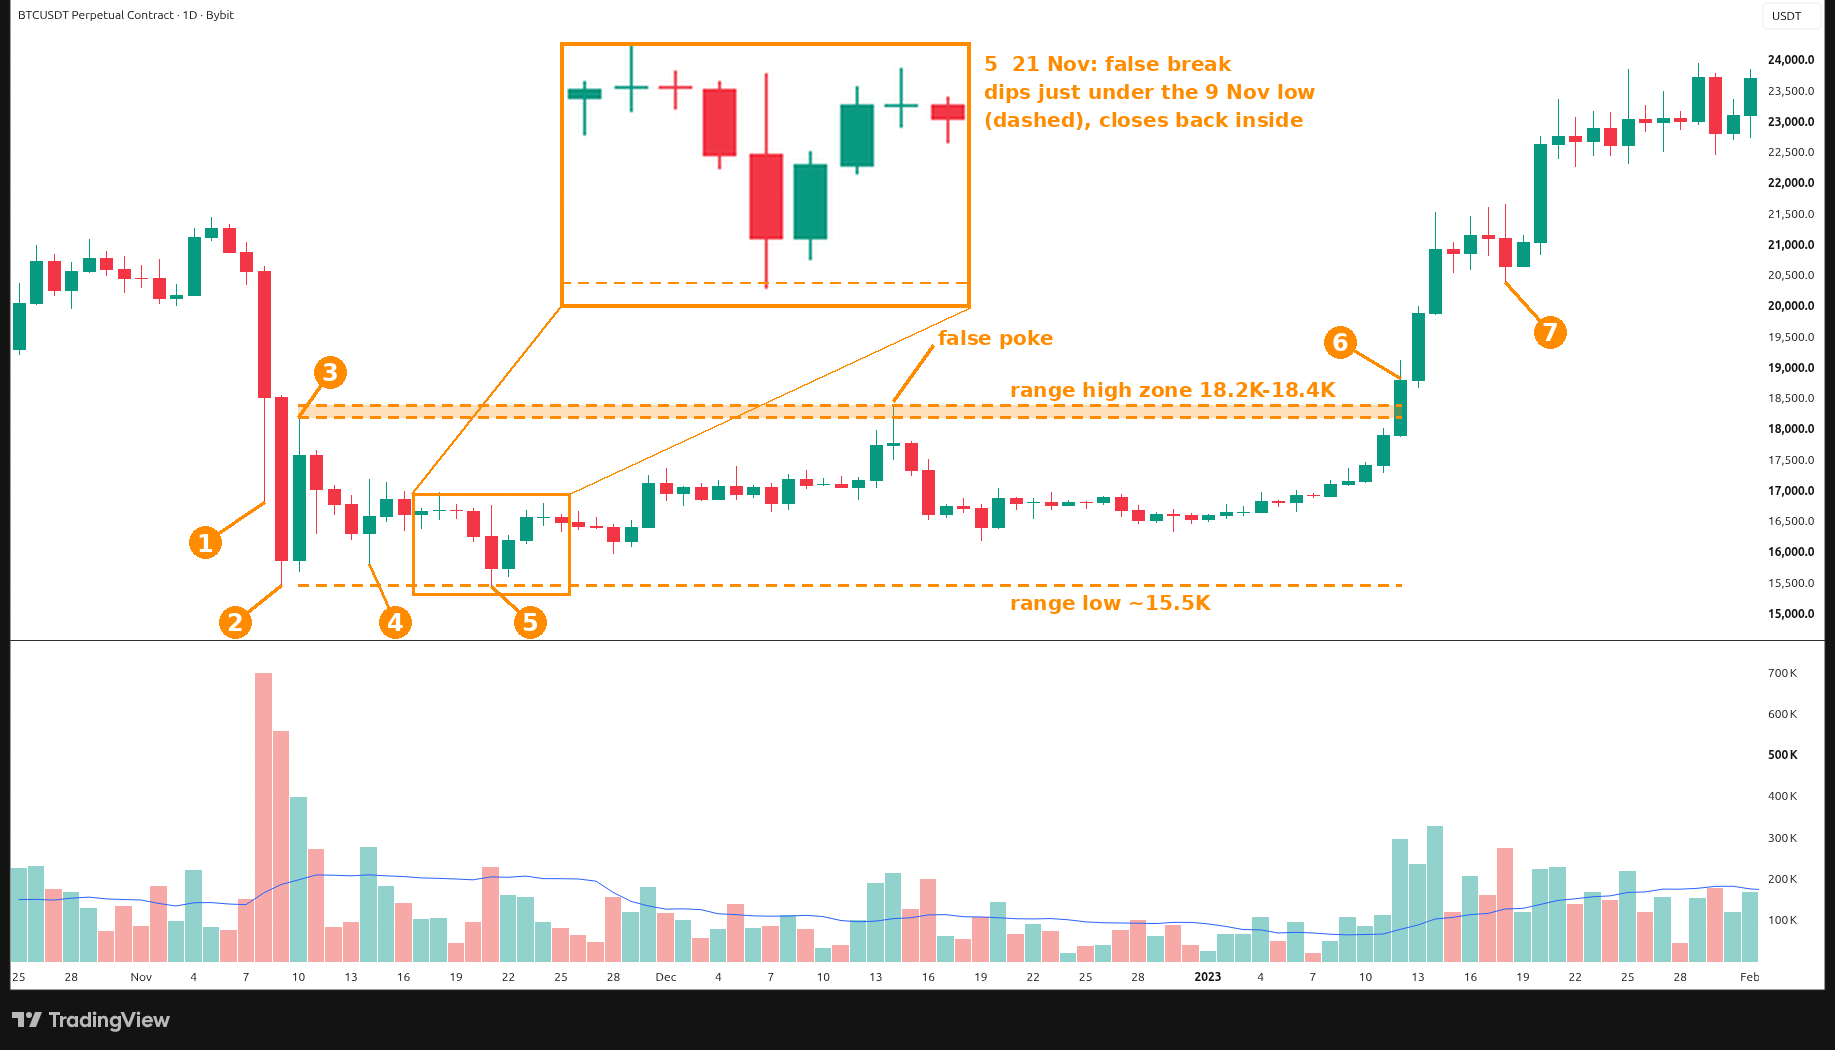
BTCUSDT perpetual, daily, Bybit. On 8 November 2022 the first stop printed a low at 16,800 on about 700K volume. On 9 November the selling climax ran down to 15,460 on about 559K. The 10 November bounce reached 18,191 and set the range high. On 14 November the retest low was 15,802 on lower volume, about 276K. On 21 November a false break undercut the climax low at 15,440 and closed back inside at 15,765.5. The real breakout came on 12 January 2023, the first daily close above the range: 12 Jan closed at 18,820 on about 296K, and price kept going to a 21,550 high on 14 Jan. The 14 December high, at 18,379, poked just above that range top and fell back, a false poke, so treat the top as a zone from 18,191 to 18,379. On 18 January the pullback low was 20,385, well above the old range.
3. Real ranges are messy
Even this example is not a textbook pattern, and that is the point.
The first stop and the climax fell on back-to-back days, so there was almost no pause between them. The first-stop volume, about 700K, was actually heavier than the climax, about 559K. The false break was shallow: it undercut the climax low by only about 20. And the pullback never came back to test the range high. It held about 2K above it.
If you wait for a perfect seven-step picture, you will wait a long time. The useful skill is to recognise the shape even when the steps are compressed, shallow, or incomplete.
4. Each step is a clue, not an entry
A climax is not a signal to buy the low. A false break is not a signal to fade every undercut. A breakout is not a signal to chase the first candle through the range high. Any of those steps can fail, and the range can last much longer than you expect.
Treat the sequence as a reason to stop guessing in the middle. In Day 19 we used volume to judge whether a move was being absorbed or was still genuine. That reading helps here too: the retest came on lighter volume, and the January breakout came on rising volume. Most of the range is chop. So stay small in the middle, and wait for the breakout to prove itself. And plan for more than one outcome, the same way we planned for three paths in Day 1: Plan 3 Paths Before Every Trade.
5. Tops often form the same way, flipped
A topping range is the same life cycle turned upside down: a first stall, a buying climax, a sharp drop that sets the range low, a retest of the high, a false break upward, a real breakdown, and a pullback that fails. The habit is the same in both cases.
Stay small in the middle, and wait for the breakout to prove itself.
← Previous: Day 20: Spotting the End of a Trend · Next: Day 22: Breakout or Fake-out? A Checklist · Browse all daily lessons
Educational only, not financial advice. Trading involves risk of loss. No profits are promised.