Not all ranges are flat.
In Day 21 we walked through how a range is built, and in Day 22 we looked at how to tell a real breakout from a fake-out. Both of those lessons are easier when the range sits still. A lot of the time, it doesn't.
These are tendencies, not a rule. But if you only draw flat lines, you will miss the shape that is actually on the chart.
1. Draw the range you actually see
Ranges often slope up or down. The highs rise, or the lows fall, and the two sides may not move at the same pace. In this lesson the lower boundary rises much faster than the upper one, so the band narrows into a rising wedge. That is still a range: price is chopping between two boundaries. It just is not a rectangle.
A flat support and resistance line across a sloping structure makes the chart look messy. Drawing the sloping boundaries usually makes the same candles obvious. You are not inventing a pattern. You are drawing the path price is already travelling.
The habit is simple: if the highs and the lows are both rising, or both falling, draw the boundaries you actually see, not two flat lines.
2. A real example: Bitcoin, summer 2022
On the Bybit BTCUSDT perpetual daily chart, Bitcoin put in a low in mid-June 2022, then chopped higher for about two months in a rising, narrowing range, and then rolled over.
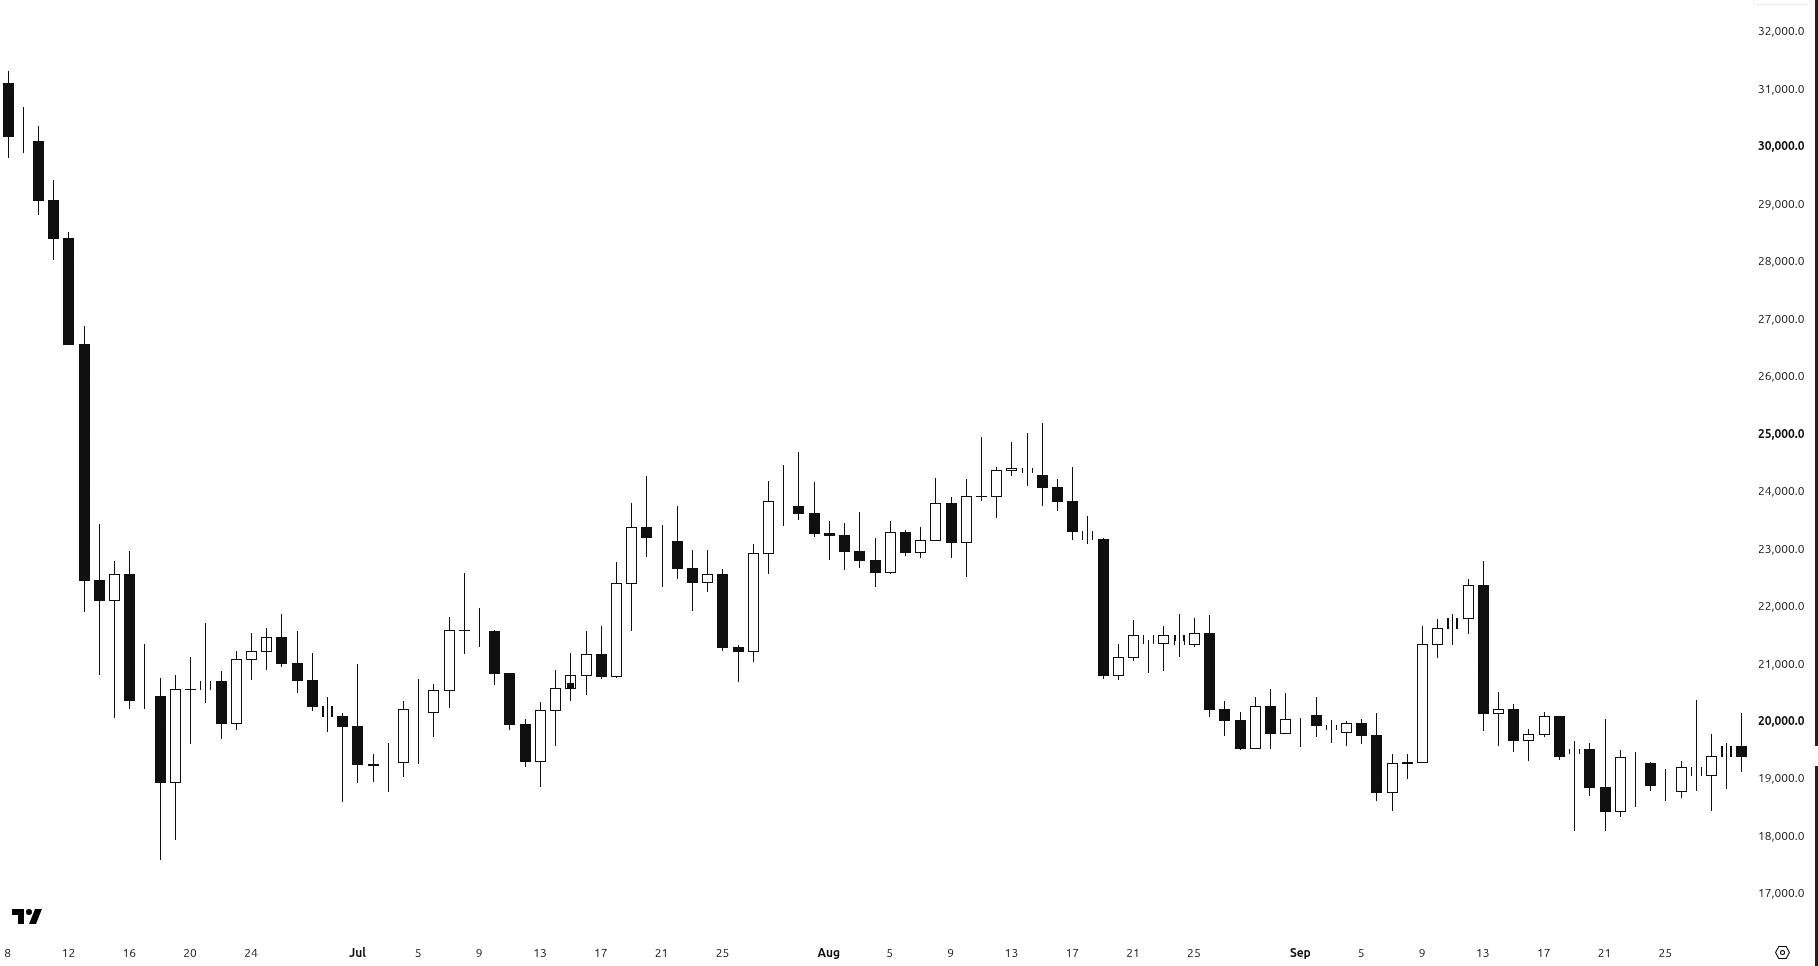
BTCUSDT perpetual, daily, Bybit. The clean view: a sharp low in mid-June 2022, a rising grind through July and mid-August, then a fade.
Here are the same candles with the rising, narrowing range marked.
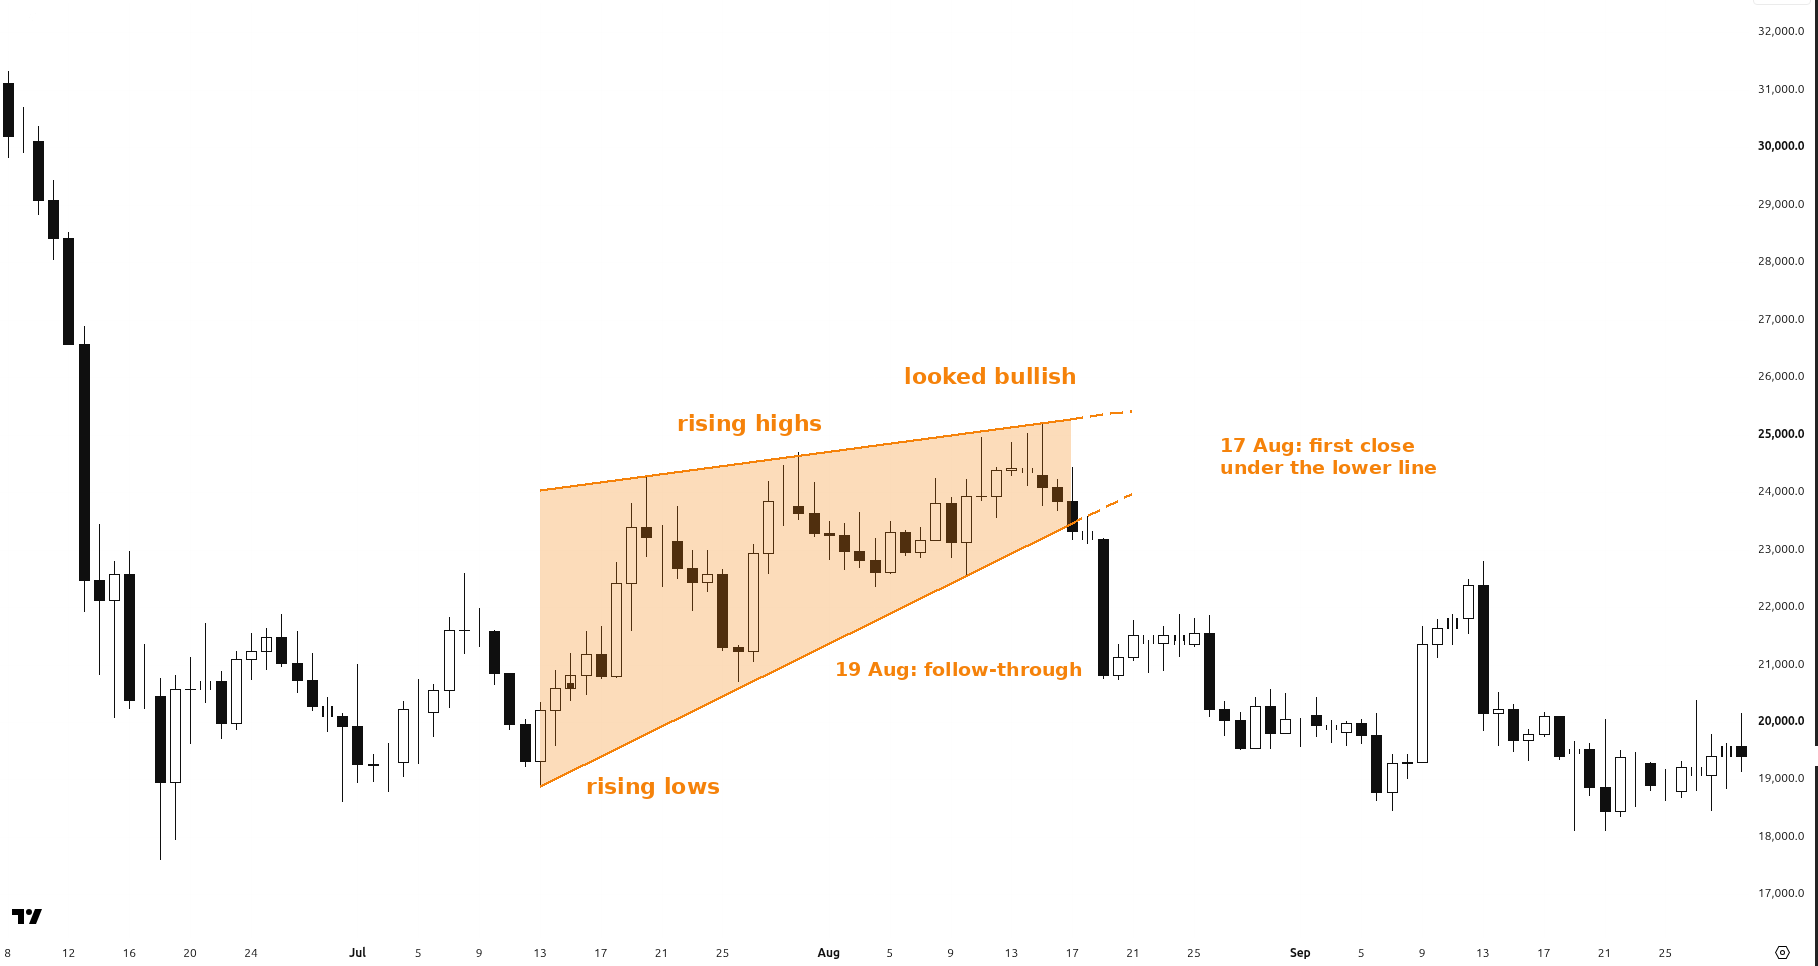
BTCUSDT perpetual, daily, Bybit. Rising lows at 18,601 (30 June), 18,867.5 (13 July), 20,691 (26 July), 22,350 (4 August) and 22,521 (10 August). Rising highs at 22,600 (8 July), 24,277 (20 July), 24,695 (30 July) and 25,199 (15 August).
If you only marked a flat low near 18,600 and a flat high near 25,200, this just looks like messy chop. The sloping lines show what was actually happening: both sides were rising, and the lower line rose nearly four times faster than the upper one, so the band narrowed by more than half.
It looked bullish. Then it faded.
By mid-August the bounce looked strong. On 15 August the high printed at 25,199, and the day closed at 24,080.5. The lower boundary was rising faster than the upper one, so the range had already narrowed a lot. On 17 August Bitcoin closed at 23,327, already below the projected lower line near 23,434. On 18 August it closed below that line again, at 23,188. On 19 August came the heavy-volume follow-through: price sold off from 23,198 down to 20,754.5, and closed at 20,819, the first daily close back under the August rising lows around 22,350 to 22,521. Volume on that day was about 312K, heavier than the quieter mid-August sessions. The bounce that followed was weak. By 28 August the low was 19,511, and by 21 September it had slipped to 18,100, back near the June area.
A rising range can look like a new uptrend. In crypto that shape shows up often, and it often rolls over. It can also keep rising. The slope itself is not a reason to buy it. It is a reason to draw the lines the way price is actually moving, then wait for the break to prove itself, the same way we did in Day 22.
3. The middle is usually the longest part
A range also has a pace. The opening, when the range first forms, is often short. The ending, when price finally leaves, can be short too. The middle, the building phase, is usually the longest stretch, and it is the part most people try to trade too early.
That middle stretch is mostly chop. As we saw in Day 21, control is often neutral in there, not with one side yet. The cleaner moment is later: once the range is finishing and a breakout starts to prove itself, or once a new trend has clearly begun. You will sit through a lot of nothing if you treat every bounce inside the range as a start.
Many traders stay small in the middle. Let the late break, or the early trend, show itself first.
4. Why the slope matters
Flat lines on a sloping range do two kinds of damage. They hide the real boundaries, so a "break" of a flat line may still be inside the range. And they make a rising range look like strength, because the chart keeps making higher highs and higher lows right up until it doesn't.
So keep the last two lessons in mind, just with better lines. Plan for more than one outcome, the way we did in Day 1: Plan 3 Paths Before Every Trade. A rising range can keep rising, or it can fade. Draw what you see, then wait for proof.
Not all ranges are flat. Draw the range you actually see.
← Previous: Day 22: Breakout or Fake-out? A Checklist · Next: Day 24 (coming soon) · Browse all daily lessons
Educational only, not financial advice. Trading involves risk of loss. No profits are promised.