Don't chase the first breakout.
In Day 21 we walked through the life cycle of a range, and saw that a false break often comes before the real move. Today is about the moment everyone gets excited: price pokes out of the range. Is it the start of a trend, or a trap?
These are tendencies, not a rule. But a few simple checks filter out a lot of fake-outs.
1. The checklist
A real breakout usually ticks three boxes:
- It closes outside the range. A wick through the top that closes back inside is not a breakout. It is a poke. The close is the evidence, not a long wick.
- It comes with volume. A real break tends to print clearly heavier volume than the bars around it.
- It travels. It moves away from the range by a real distance rather than hovering just above the line. A rough guide, not a universal definition, is more than about 20% of the range's height.
And one habit: don't chase the breakout candle itself. A slower pullback that holds can give better confirmation after the break.
2. A real example: Bitcoin, 2023
On the Bybit BTCUSDT perpetual daily chart, Bitcoin spent June to October 2023 inside a wide range.
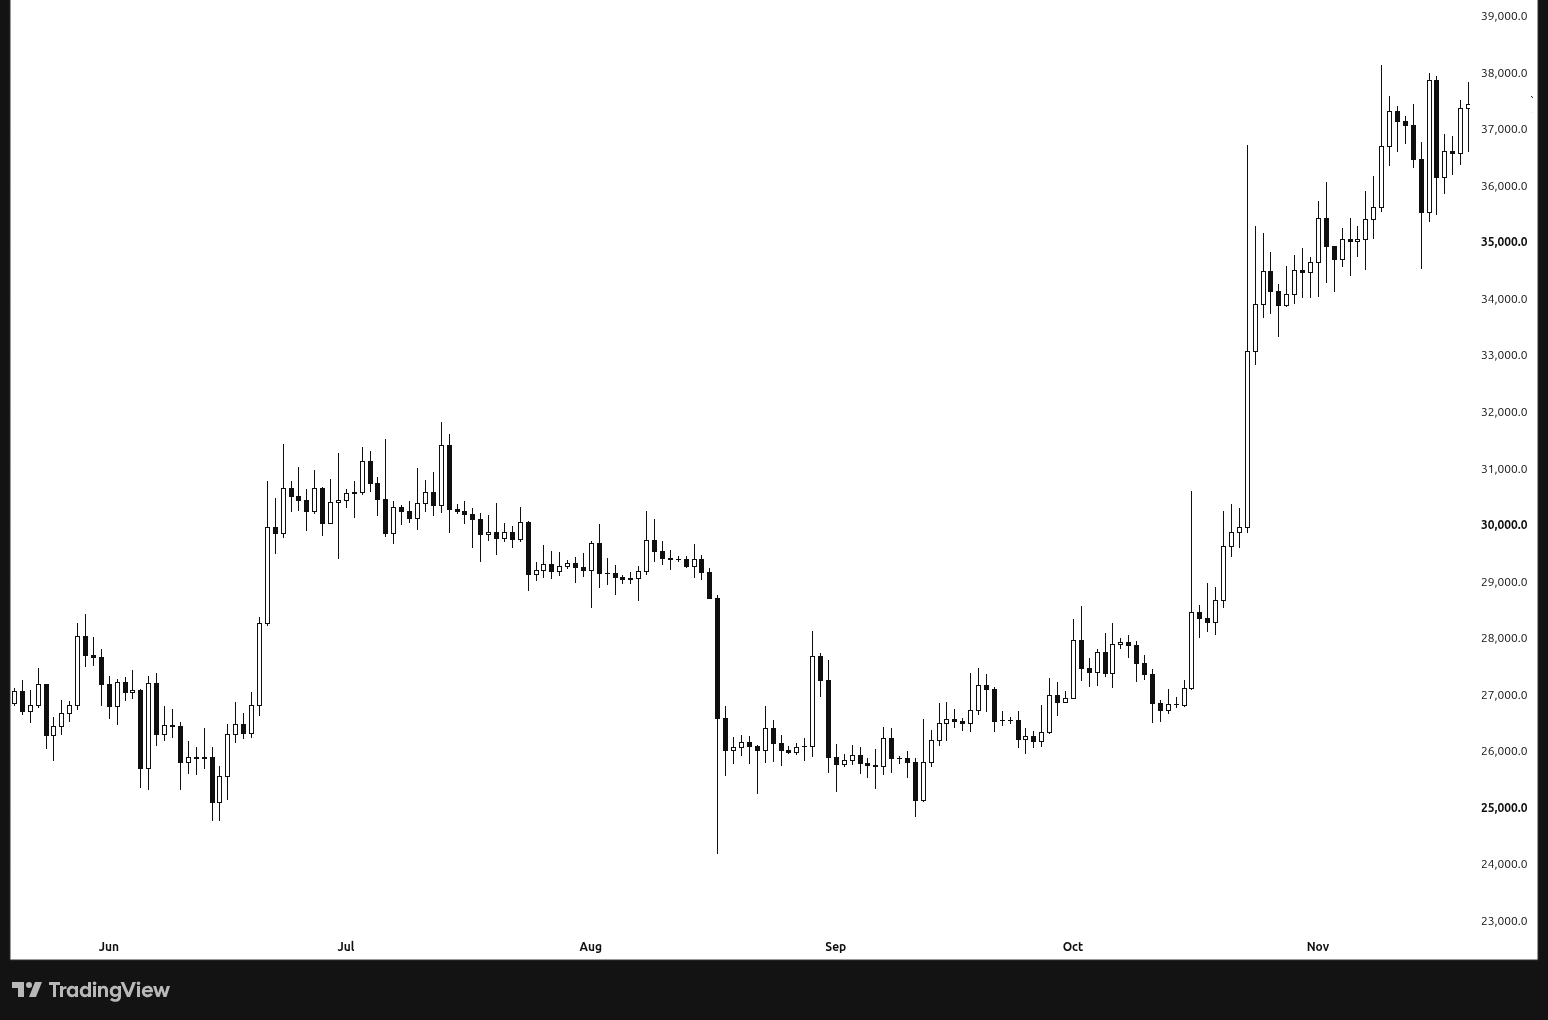
BTCUSDT perpetual, daily, Bybit. The clean view: a jump in June, months of sideways chop, a drop in August, then a sharp move higher in late October.
Here are the same candles with the key moments marked.
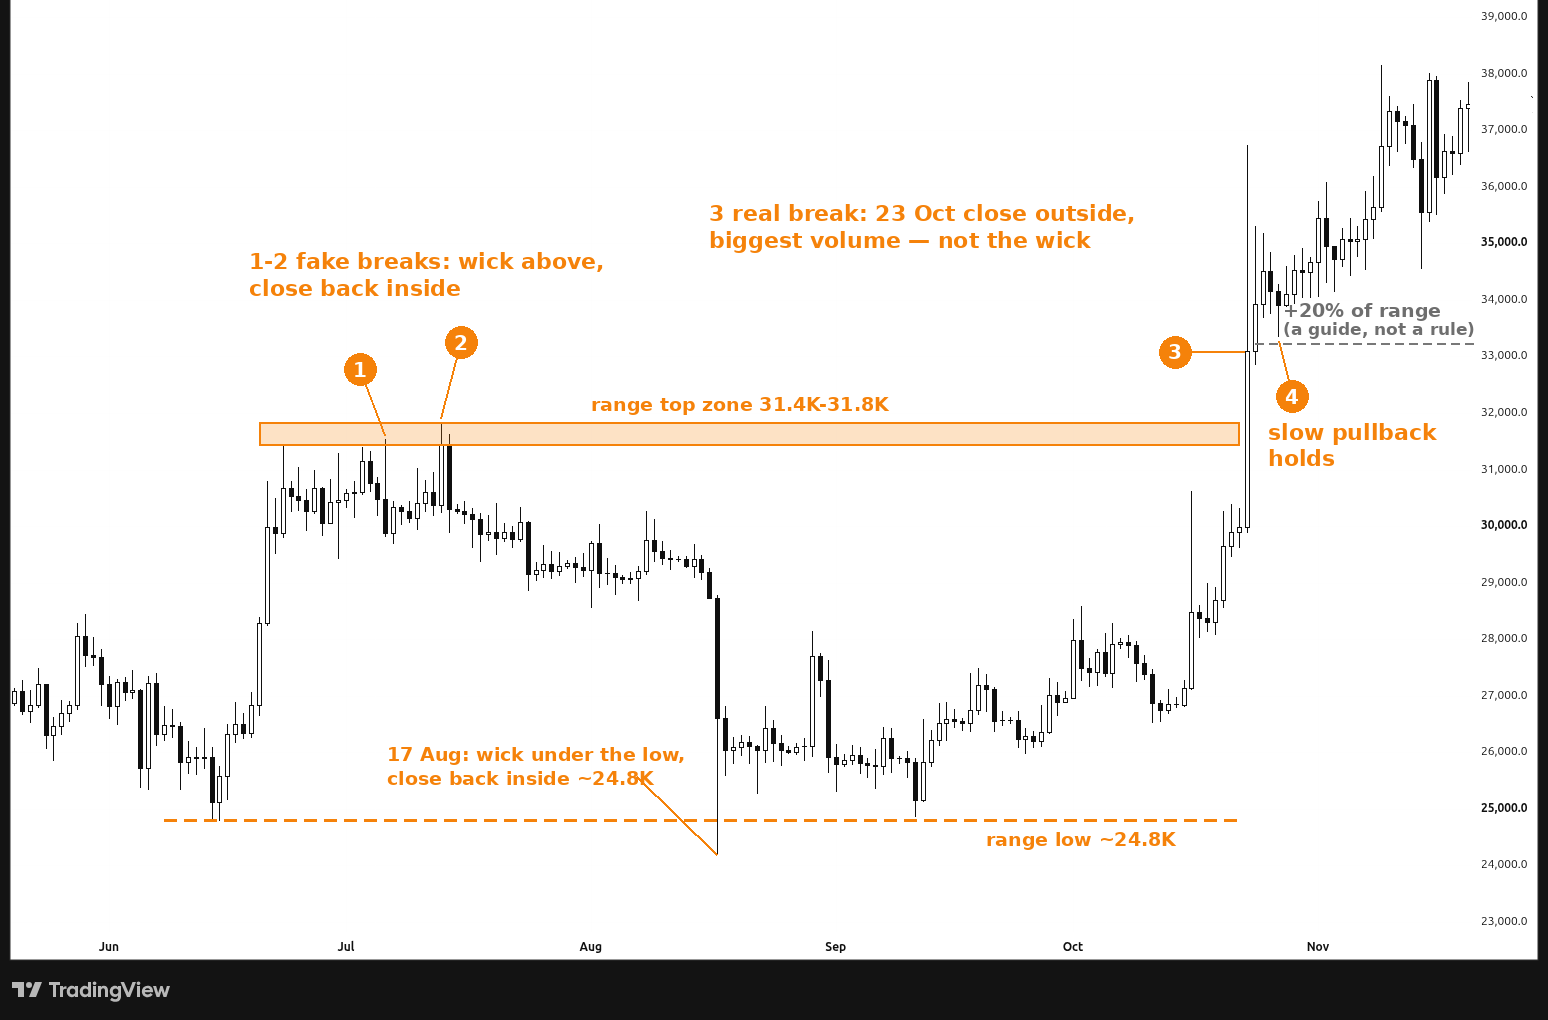
BTCUSDT perpetual, daily, Bybit. The range top is a zone: the 23 June high at 31,444 and the 13 July high at 31,843.9. The range floor sits near 24,779.5 (14 to 15 June) and 24,853.4 (11 September).
Fake-out 1 and 2: wicks above, closes back inside
On 6 July price pushed above the June high to 31,543, then closed the day at 29,875, back inside the range. On 13 July it tried again, reaching 31,843.9, but closed at 31,437, still under the June high. The next day it closed at 30,295. Two pokes, no close outside. Anyone who bought those candles was soon underwater.
The real break: the 23 October close
On 23 October Bitcoin closed at 33,092.9, the first daily close above the whole top zone (31,843.9). That close is the evidence, not the 36,743.5 wick printed on the same day. That session also printed about 397K BTC of volume, the heaviest daily volume on this chart from June to November 2023.
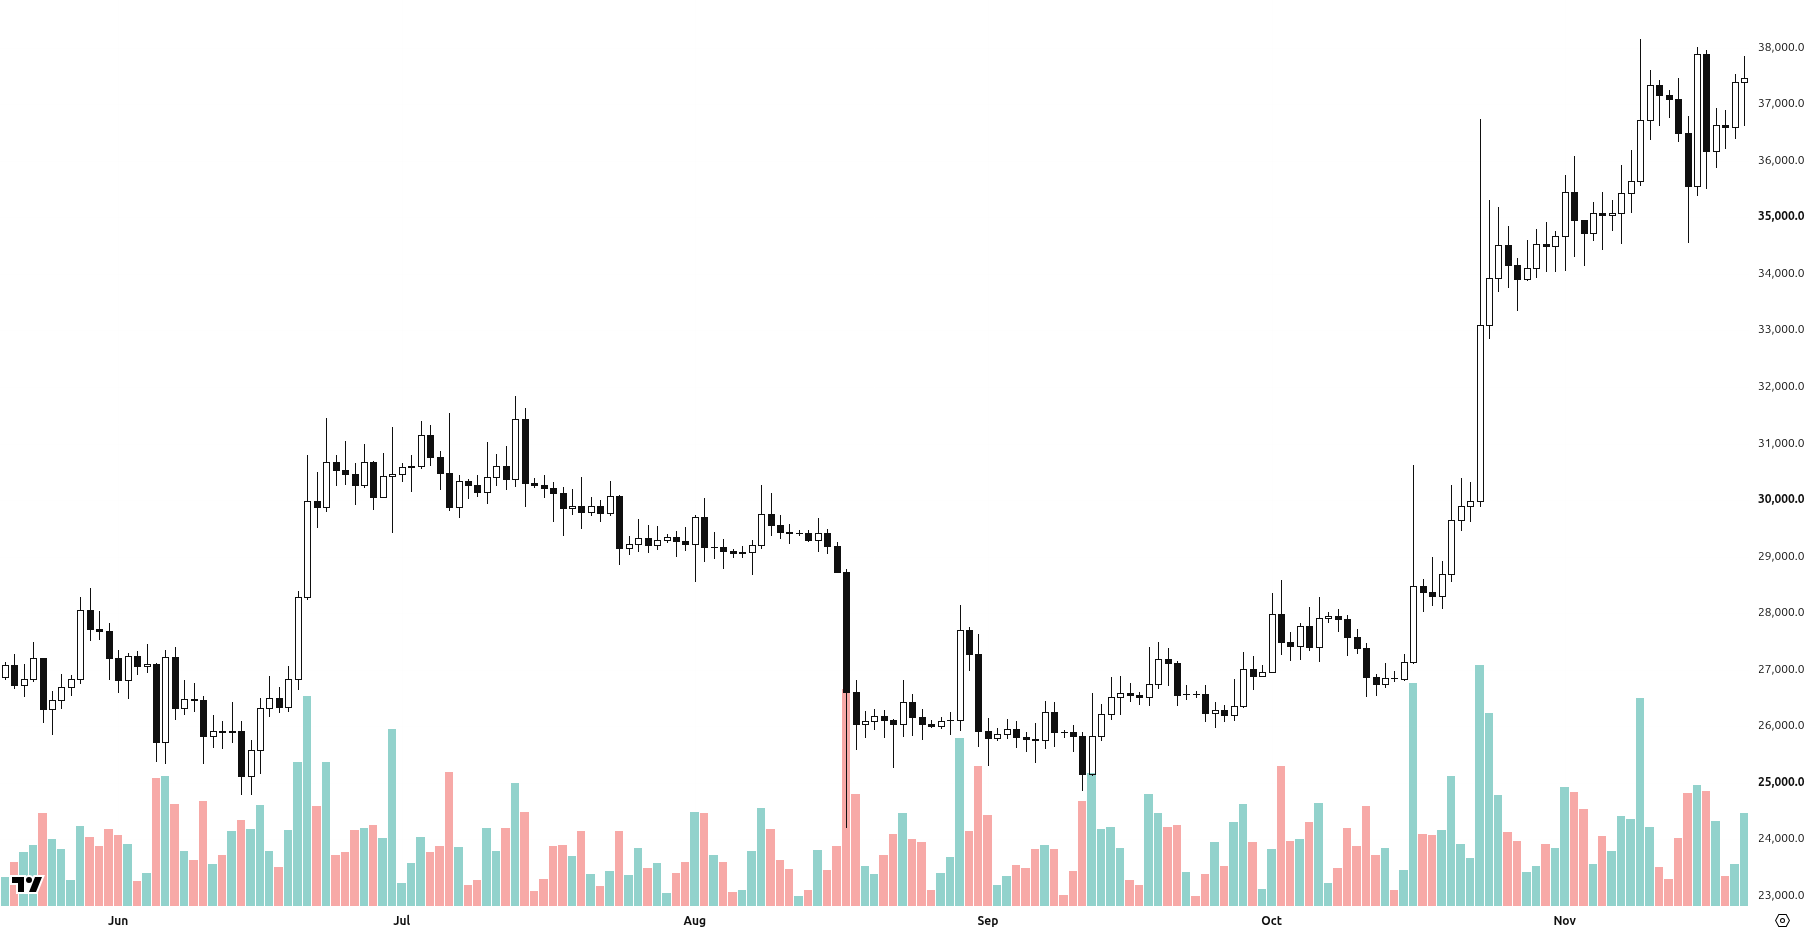
BTCUSDT perpetual, daily, Bybit, with volume. The 23 October breakout bar is the tallest volume bar in the window.
Distance is measured separately. The range was 7,064.4 tall (24,779.5 to 31,843.9), so 20% of it is 1,412.9, and the 20% guide sits at 33,256.8. The 23 October close, 33,092.9, was 1,249 above the top, or 17.7% of the range height, short of that guide. The next day, 24 October, closed at 33,935.8, about 2,091.9 above the top, or about 30% of the range height. That is when this example cleared the 20% guide. The 20% figure is a heuristic, not a definition that every breakout must meet.
The pullback that held
From 26 to 31 October price drifted lower slowly. The daily lows stayed between about 33,350 and 34,041, well above the old range top, and volume dropped to roughly 54K to 121K a day, far below the breakout day. That quiet, shallow pullback is what holding looks like in this example. Price never even came back to the old top before moving on.
3. Fake-outs happen at the bottom too
On 17 August Bitcoin wicked down to 24,200.9, under the range floor near 24,779.5, then closed the day at 26,610.1, back inside. The same idea works flipped: a wick under support that closes back inside is a poke, not a breakdown.
4. Why confirmation helps
The first push out of a range is often where the most traders pile in, and where the trap is set. Checking for a close outside, real volume and real distance means you will miss the very first candle. That is fine. As we saw with volume in Day 19, a move that is real tends to show it. And whatever you do, plan for more than one outcome, the way we did in Day 1: Plan 3 Paths Before Every Trade.
Don't chase the first breakout. Let it close outside, show volume and travel. A slower pullback that holds can give better confirmation.
← Previous: Day 21: The Life Cycle of a Trading Range · Next: Day 23: Sloped Ranges: The Pattern Most Traders Miss · Browse all daily lessons
Educational only, not financial advice. Trading involves risk of loss. No profits are promised.