Most trends end in one of two ways: loud, or quiet.
In Day 19 we looked at effort versus result: when heavy volume barely moves price, the move is often being absorbed. Today we take the next step. Once you can read volume against the candle, you can start to see how a trend often runs out of steam.
1. Loud or quiet
A trend does not have to die in a single dramatic candle. It usually fades in one of two patterns.
The first is a climax. Volume explodes at the extreme. The late crowd rushes in, or panics out, and then price cannot push any further.
The second is exhaustion. Volume dries up, price drifts, and nobody is left to push it. That quiet drift often ends with a sharp move the other way.
These are tendencies, not rules. A trend can also stall when price and volume start to disagree in other ways, which is why we say most trends, not every trend.
2. The climax: when it gets very loud
In a climax, the last push is the noisiest one. Volume is huge at the high or the low, everyone who was going to pile in or bail out does it at once, and then the next candles fail to follow through.
On a selling climax, that often looks like a panic flush: a wide candle, the tallest volume bar in weeks, and then the market cannot make a new low. On a buying climax at a top, it is the same idea the other way around: a late rush in, huge volume, and then price cannot make a new high.
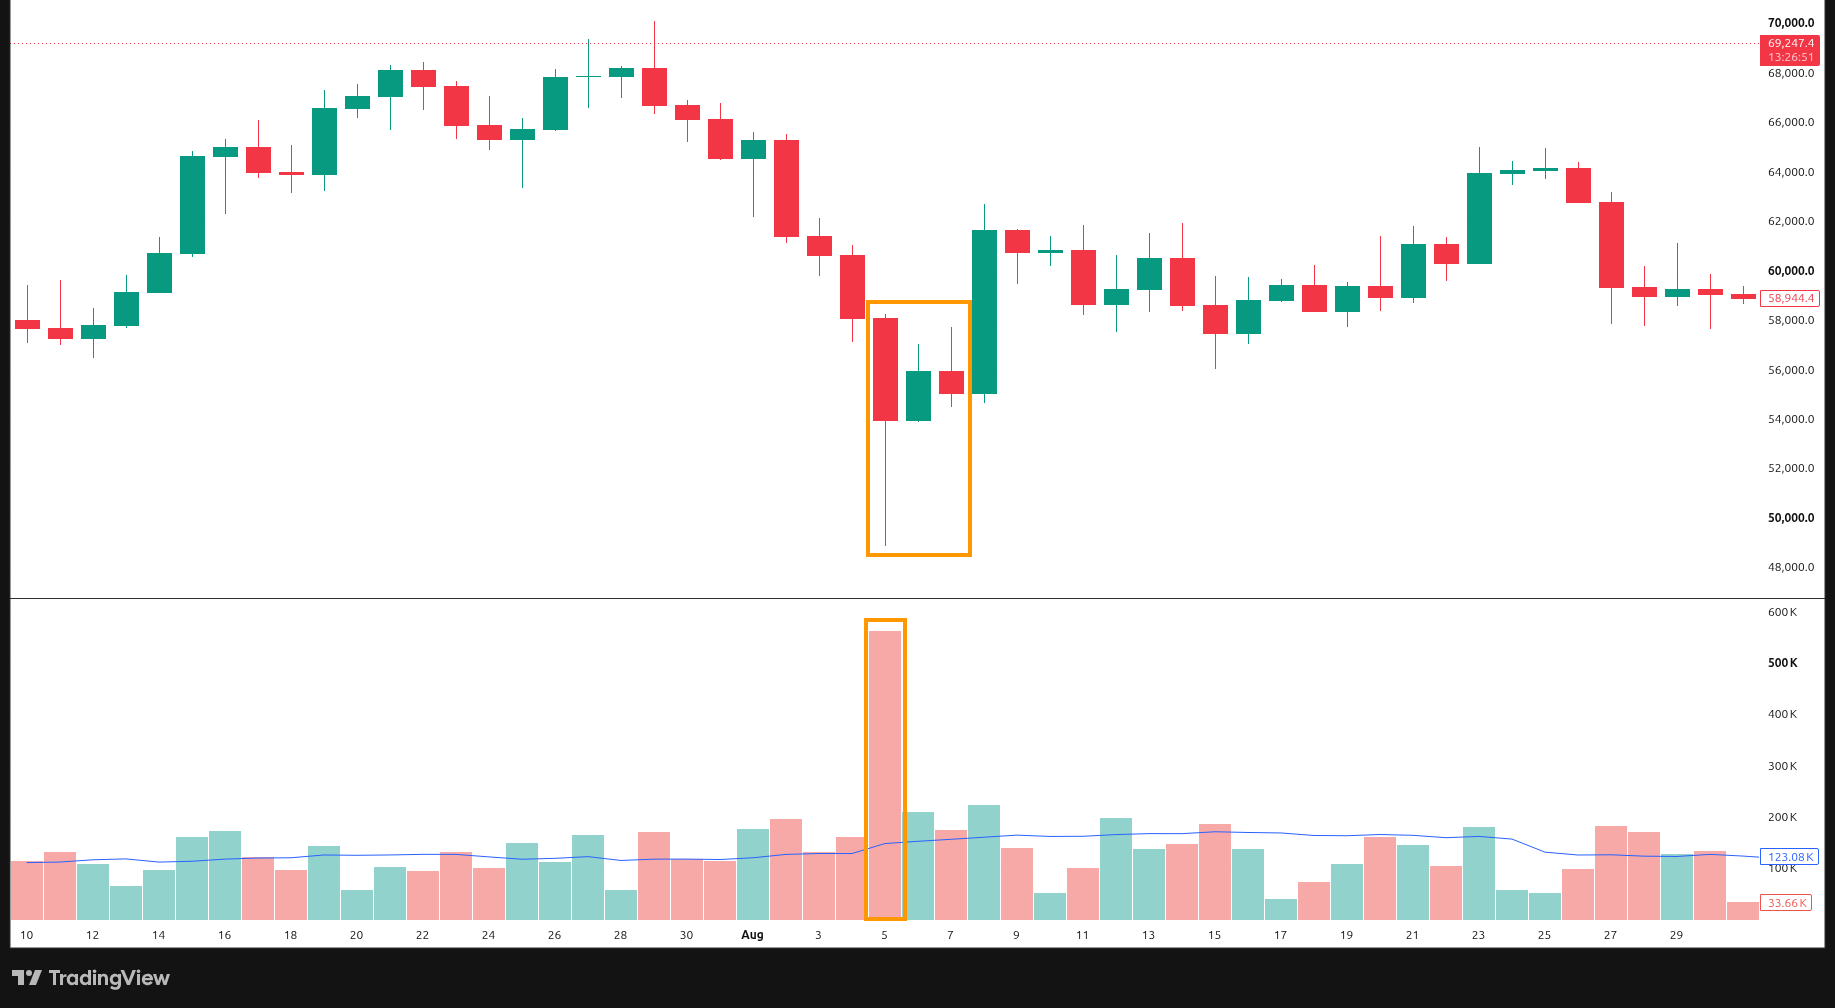
BTCUSDT perpetual, daily, Bybit. On 5 August 2024 Bitcoin opened at 58,132, spiked only to 58,278, sold off to 48,914 and closed at 53,988. Volume was about 563K, against about 114-196K on the seven days before. On 6 and 7 August the lows were 53,917 and 54,518, so there was no lower low, and on 8 August the high reached 62,743.
That is a selling climax: volume exploded at the low, the late crowd panicked out, and then price could not push further down. The next days failed to make a new low, and the market bounced.
3. Exhaustion: when it gets very quiet
Exhaustion is the opposite mood. After a real rally or sell-off, volume fades, price drifts rather than trending cleanly, and the 20-day average volume often slopes down. Weekend bars can look quiet too, so it is fairer to read the fade on the average, or on weekdays, rather than on a Saturday or Sunday bar alone.
Then, with nobody left to push it, the quiet stretch often breaks with a sharp move the other way.
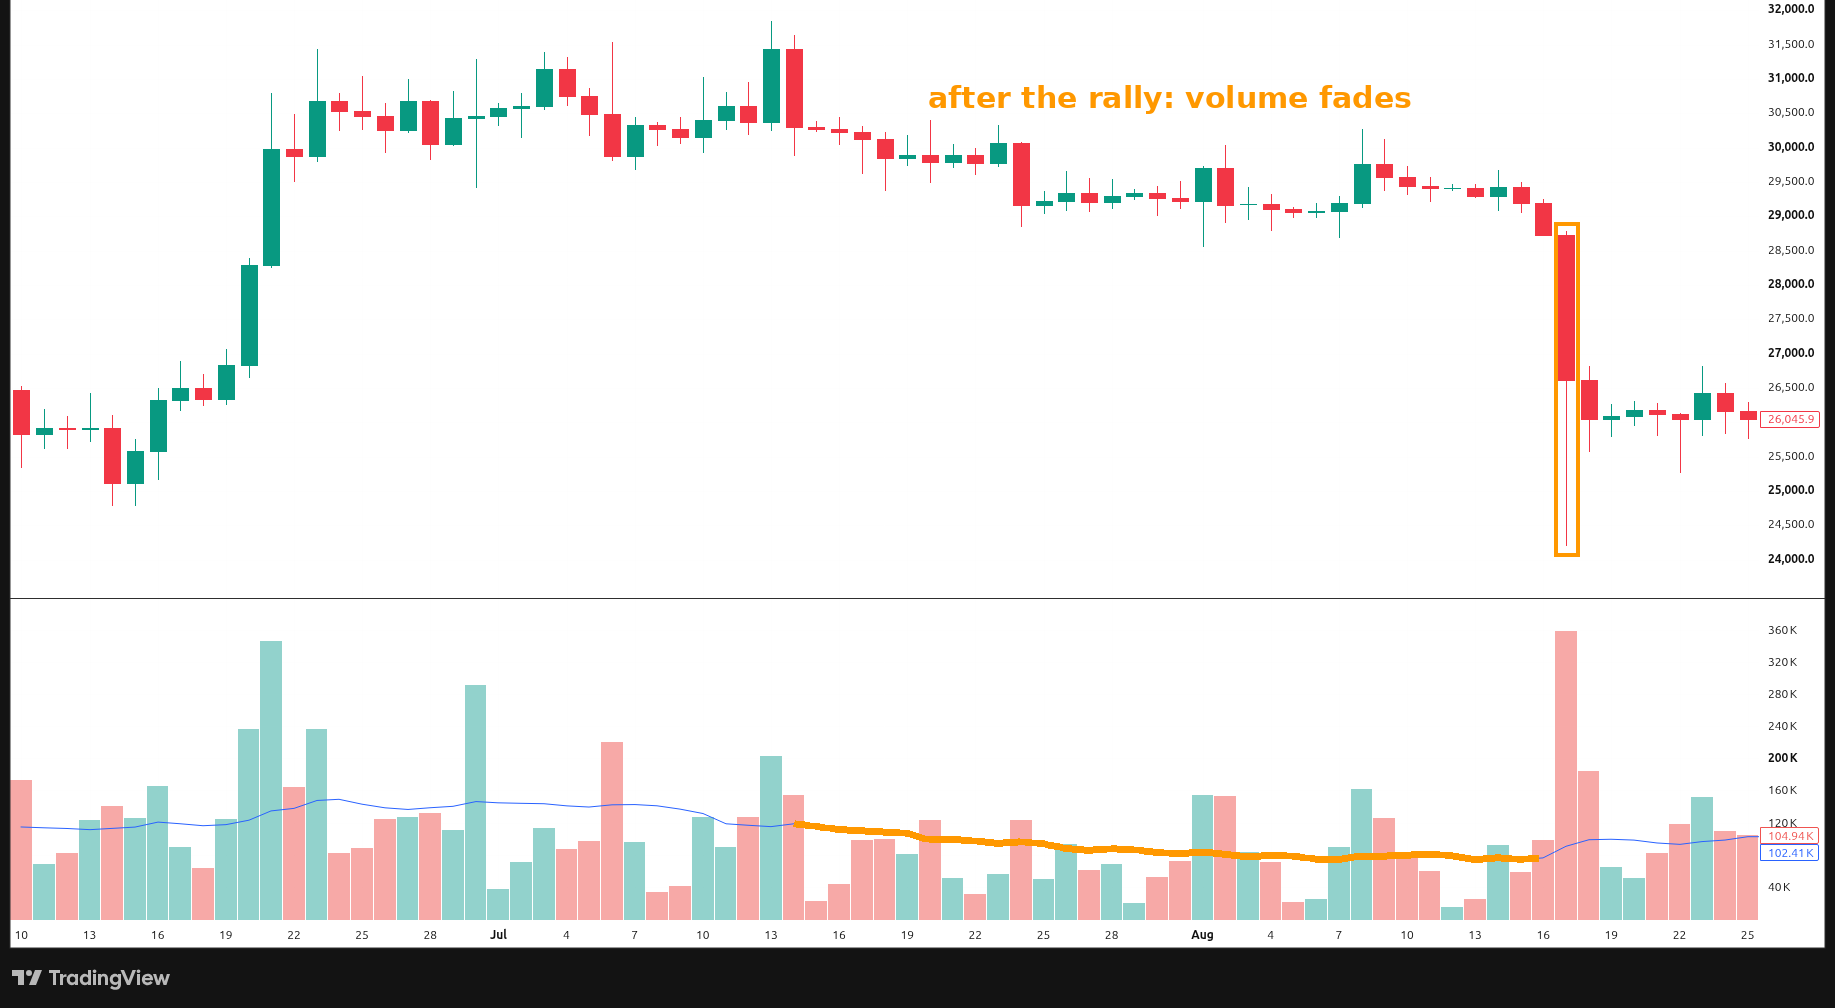
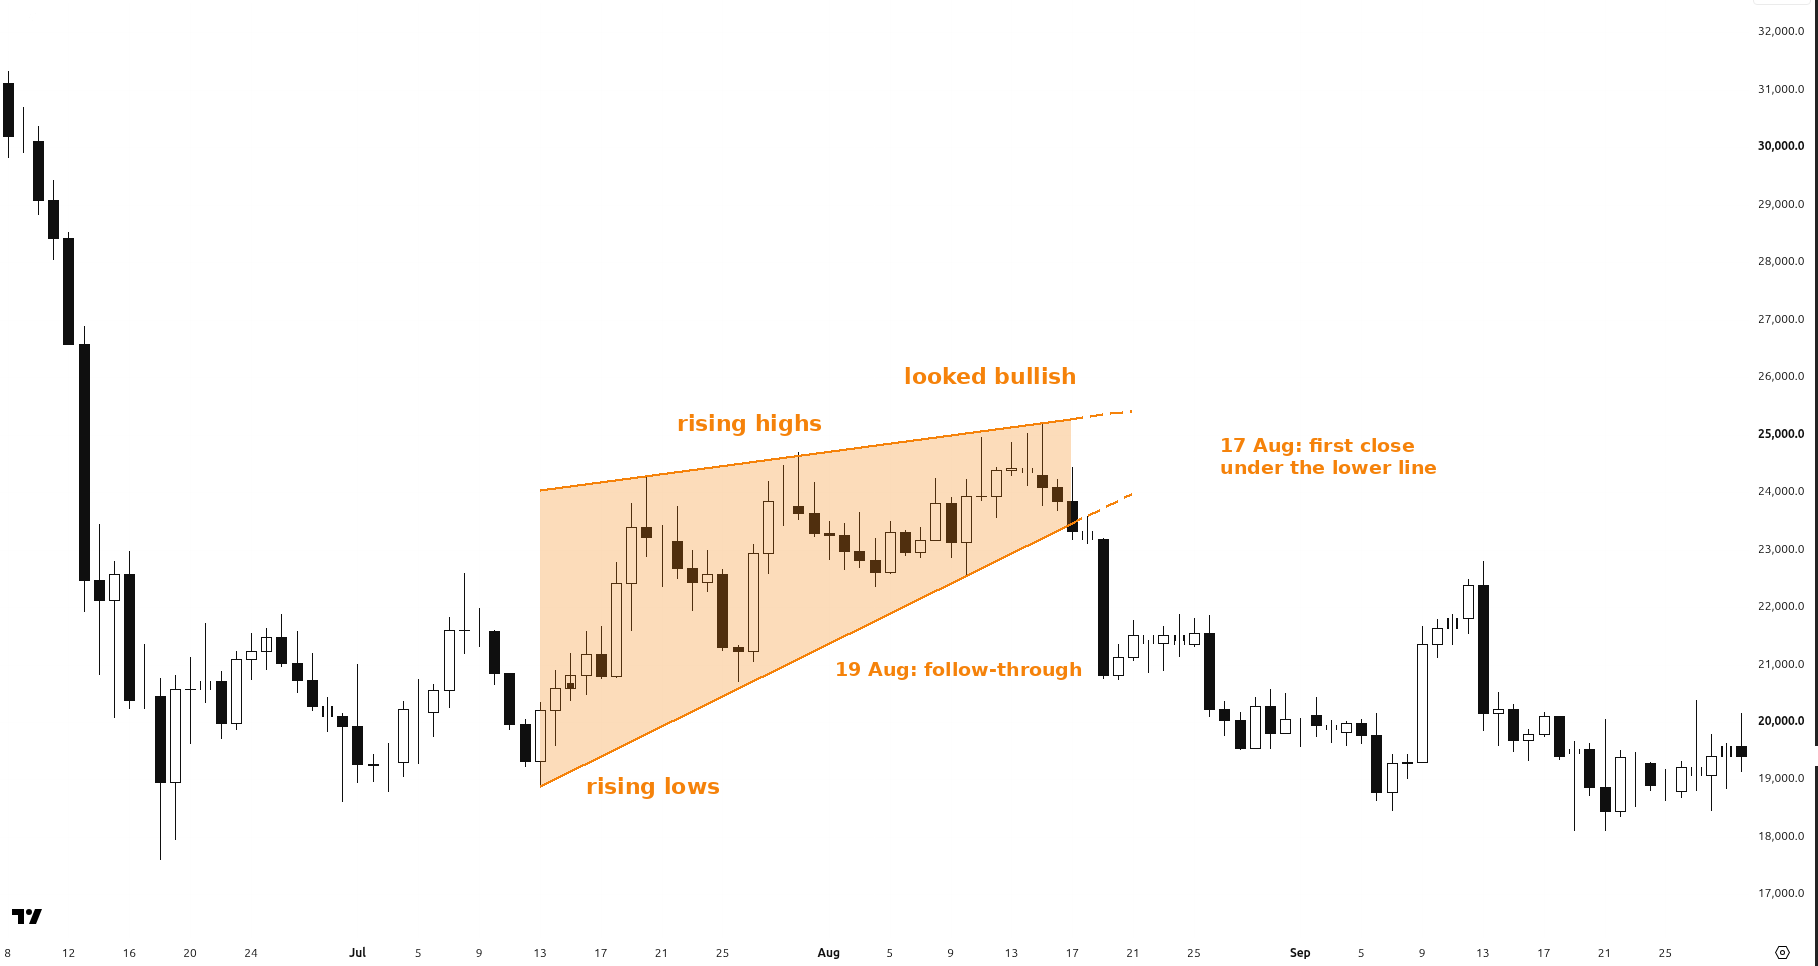
BTCUSDT perpetual, daily, Bybit. After the mid-June run from about 25K, Bitcoin made a 13 July 2023 high at 31,844 on about 202K volume. Price then mostly drifted between 29K and 30K. The 20-day average volume fell from 118.5K on 14 July to 74.0K on 7 August and 76.0K on 16 August. On 17 August it opened at 28,728, traded down to 24,201 and closed at 26,610 on about 358K, the biggest bar in months.
You can see the whole sequence: the rally, the quiet drift as volume faded, then the sharp drop. That is why this example starts in mid-June, not in July. If you only looked at the drift, it could be mistaken for part of a decline already underway.
4. Neither one is an entry on its own
A climax is not a signal to fade the move the moment you see the tall volume bar. Exhaustion is not a signal to fade the drift the moment volume looks quiet. Both can fail, and both can run on further than you expect.
Treat them as a reason to stop chasing the trend, not as an entry. If you are already in, it is a reason to tighten your plan. If you are waiting to enter, wait for price to confirm, the same way we planned for three outcomes in Day 1: Plan 3 Paths Before Every Trade.
5. Too loud or too quiet? Stop chasing
When a trend gets very loud at the extreme, or very quiet after a long run, the useful response is usually to stop pressing the same side. Watch the effort, judge the result, and let the next candles tell you whether the move is actually over.
Too loud or too quiet? Stop chasing.
← Previous: Day 19: Volume Tells You If a Move Is Real · Next: Day 21: The Life Cycle of a Trading Range · Browse all daily lessons
Educational only, not financial advice. Trading involves risk of loss. No profits are promised.