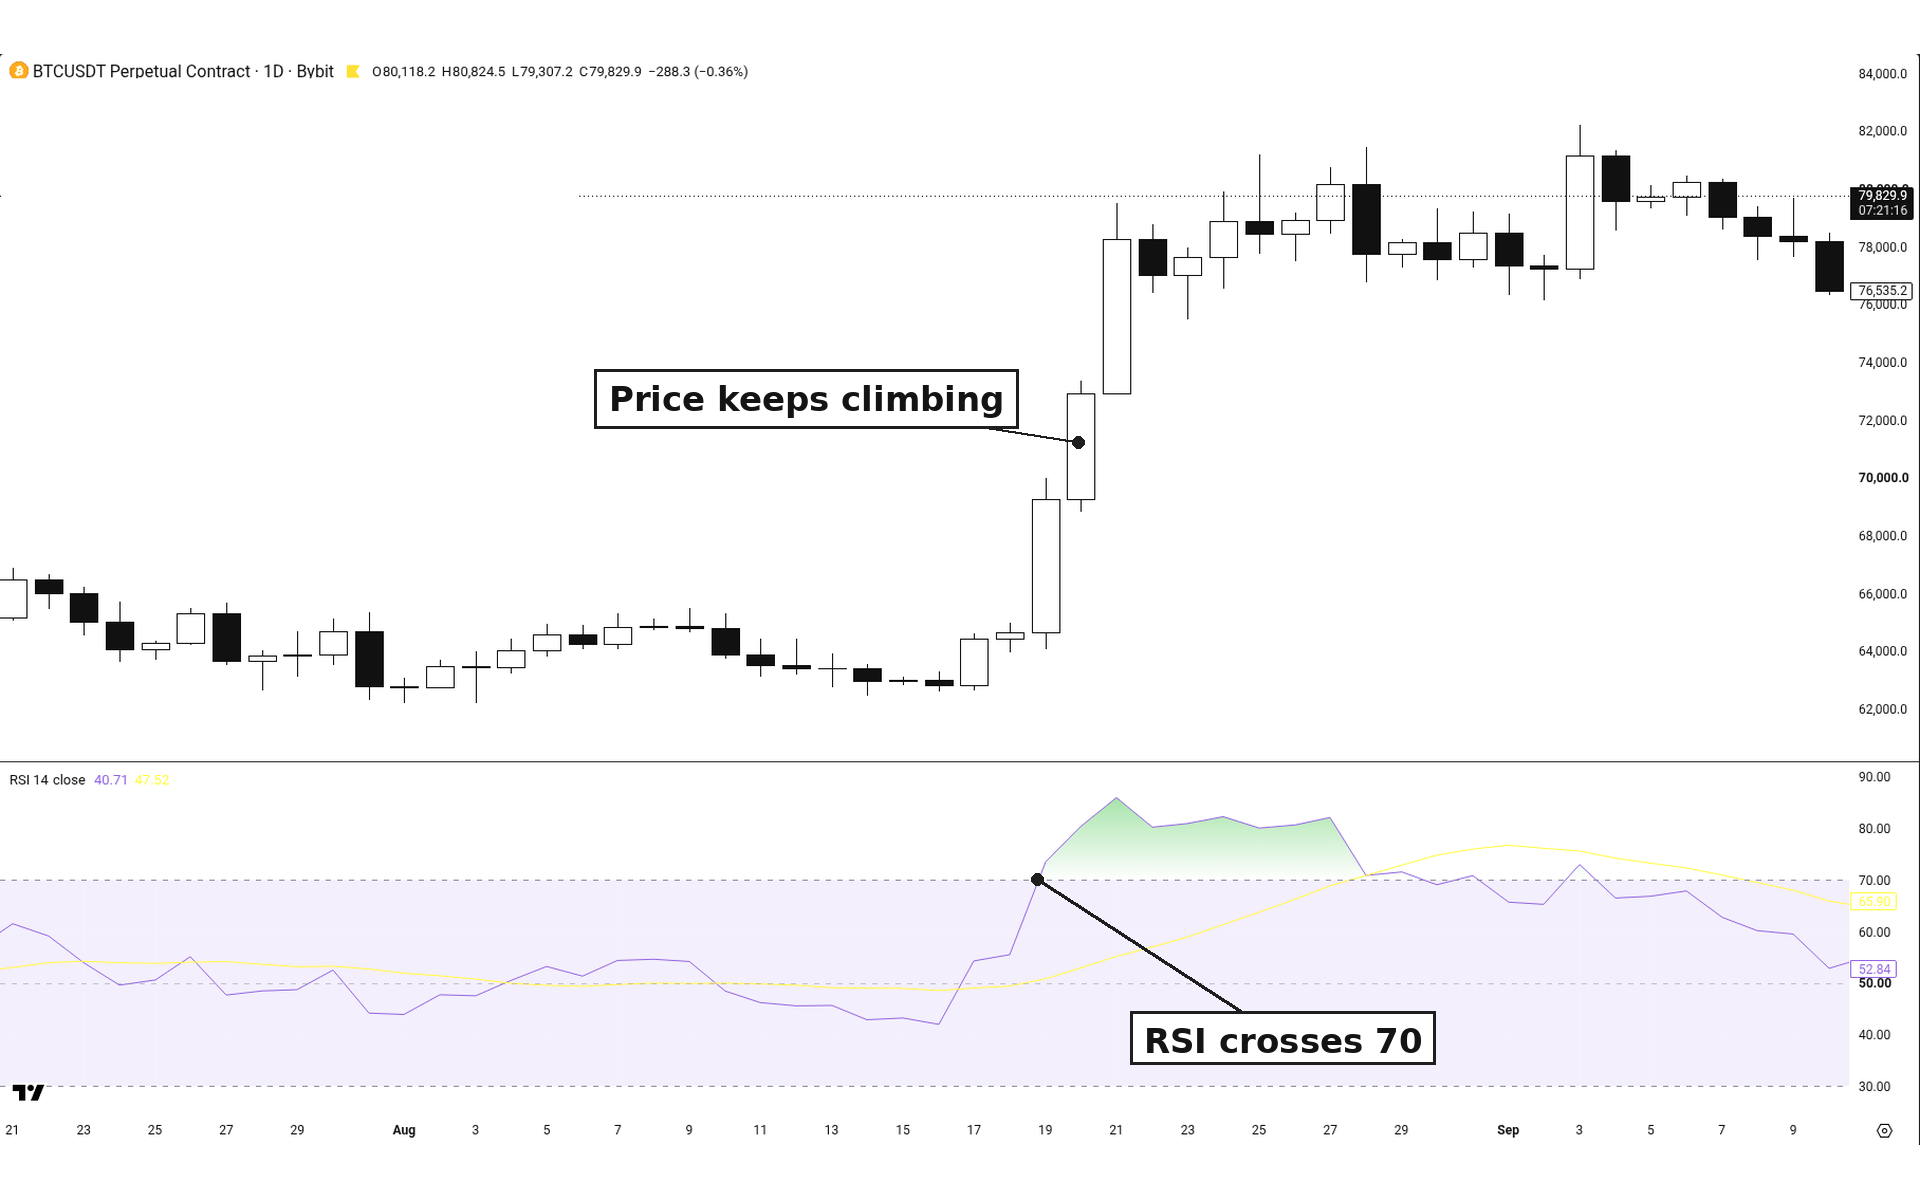
Your reversal trade keeps failing because trends rarely flip straight away. They usually pause first.
Price rallies hard. Then it stops making new highs, and a lot of traders shout "that's the top" and sell. But price doesn't drop. It goes sideways. This lesson is about that sideways zone: what it is, why it hurts so many traders, and the simple habit that keeps you out of trouble.
Trends don't turn on a dime
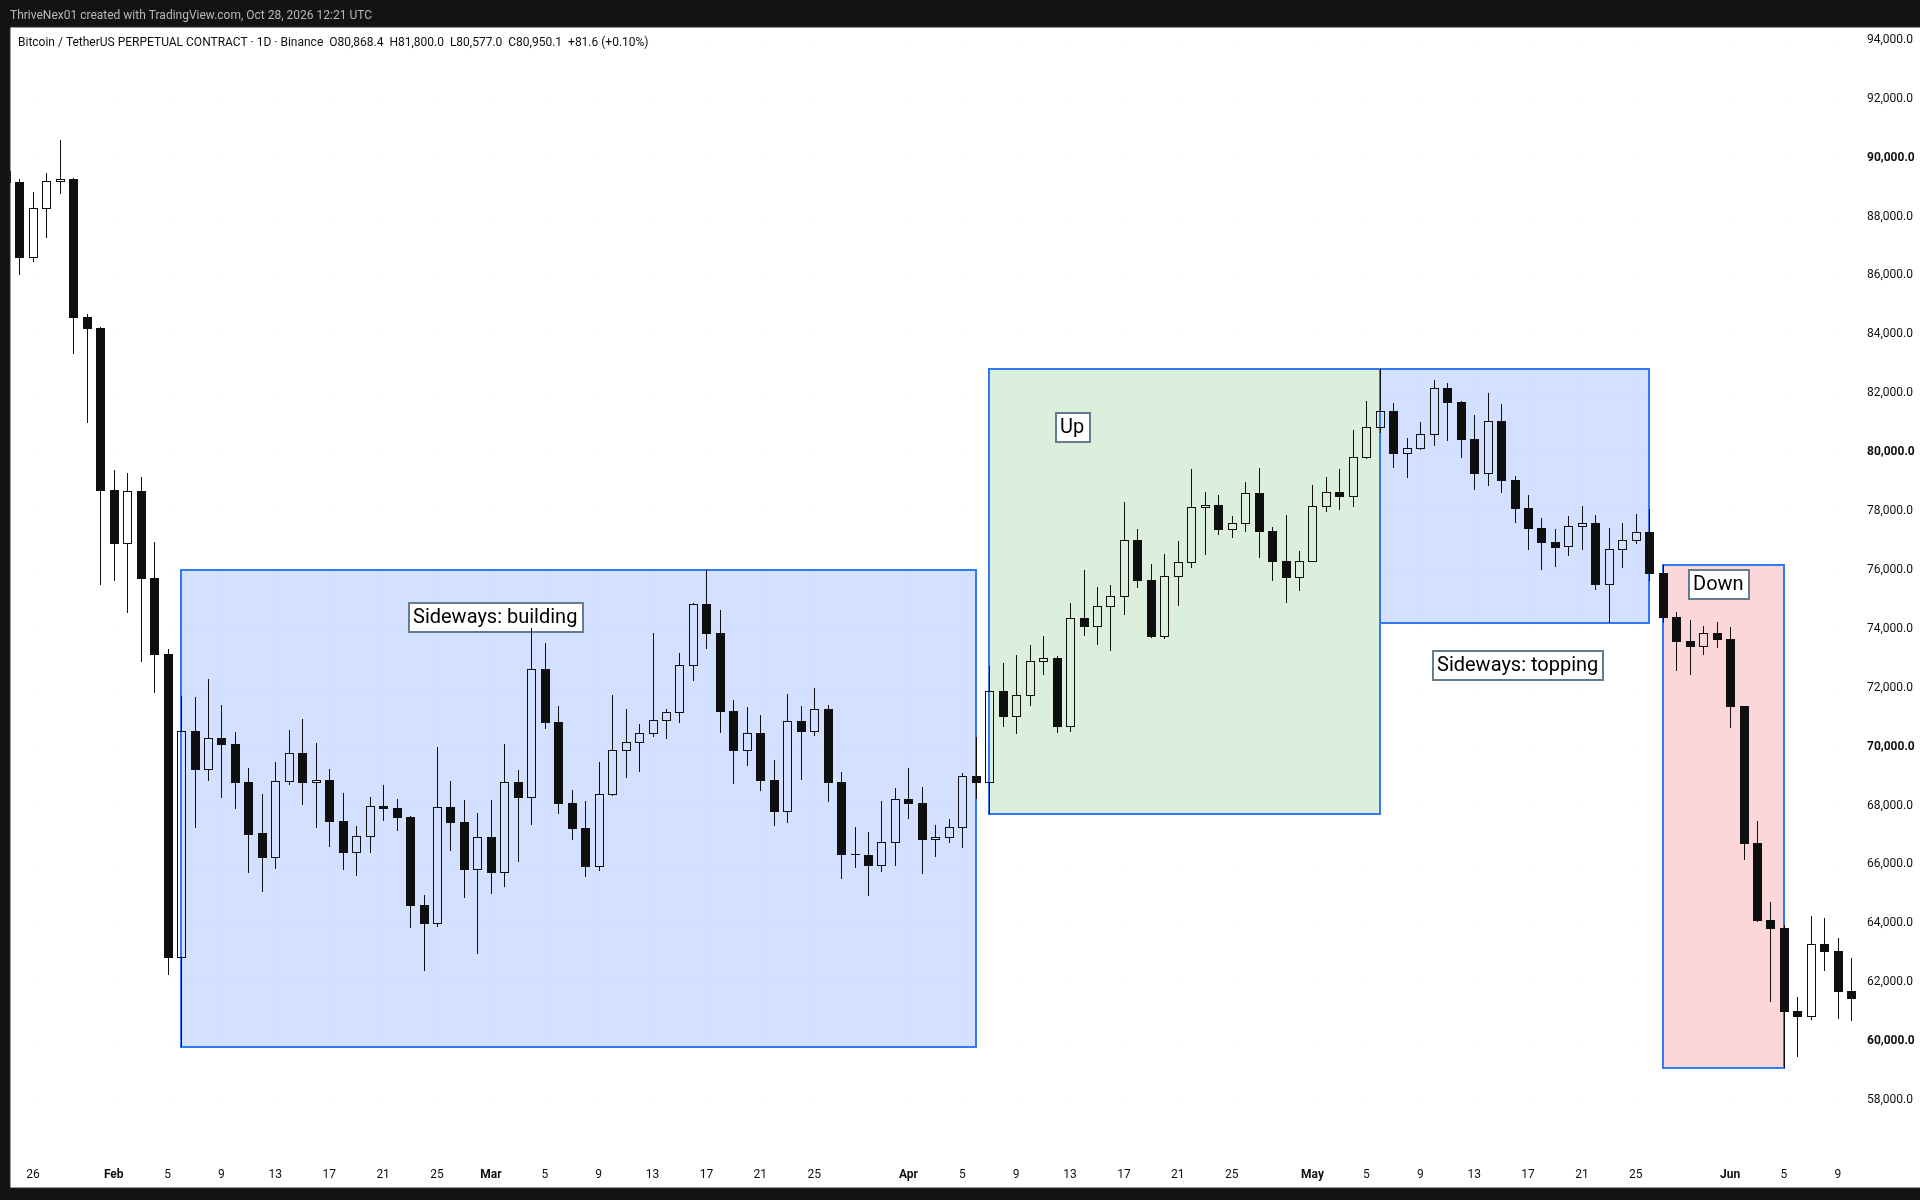
Back in Day 7 we covered the four phases every market moves through: accumulation, markup, distribution and markdown. Look at the order. Between the markup (the uptrend) and the markdown (the downtrend) sits distribution, a range. Between markdown and the next markup sits accumulation, also a range.
So a trend usually passes through a range before it turns. It rarely flips straight from up to down. And markets often spend more time ranging than trending. Sideways is normal, not the exception.
That pause can end two ways. If it turns out to be re-accumulation, the trend continues. If it turns out to be distribution, it reverses. While you're inside the range, you don't know which one it is yet.
Why the sideways zone chops people up
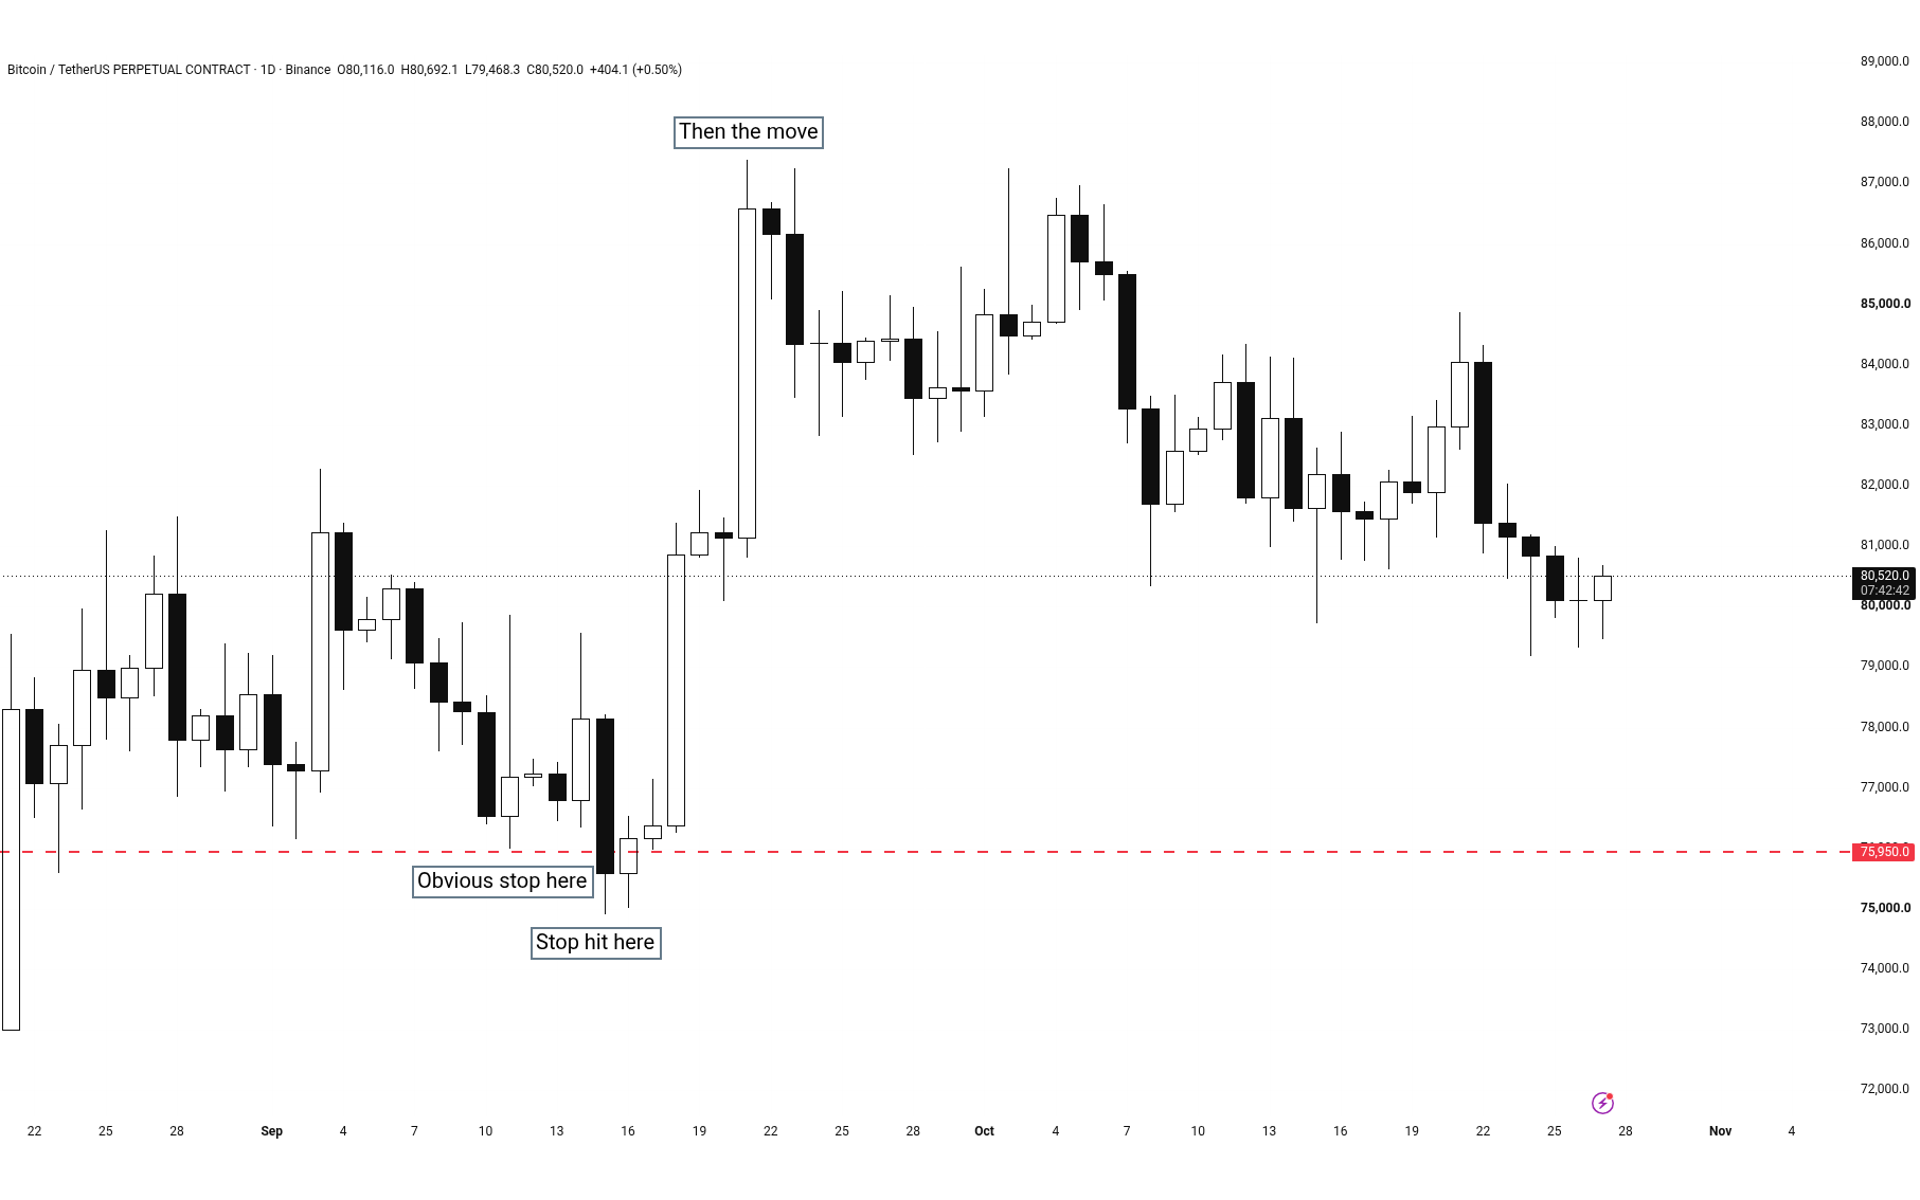
When the trend stops, many traders keep chasing each move. Some keep buying dips, expecting the uptrend to carry on. Others jump in short, sure the top is in. Inside a range, both groups get hit: price pokes above the recent high and stops out the shorts, then dips below the recent low and stops out the longs. Up, down, up, down.
A useful early clue: in a healthy uptrend, pullbacks are shallow. When a pullback gets very deep (around 75% or more of the last move), a range is probably forming, so stop treating it like a trend.
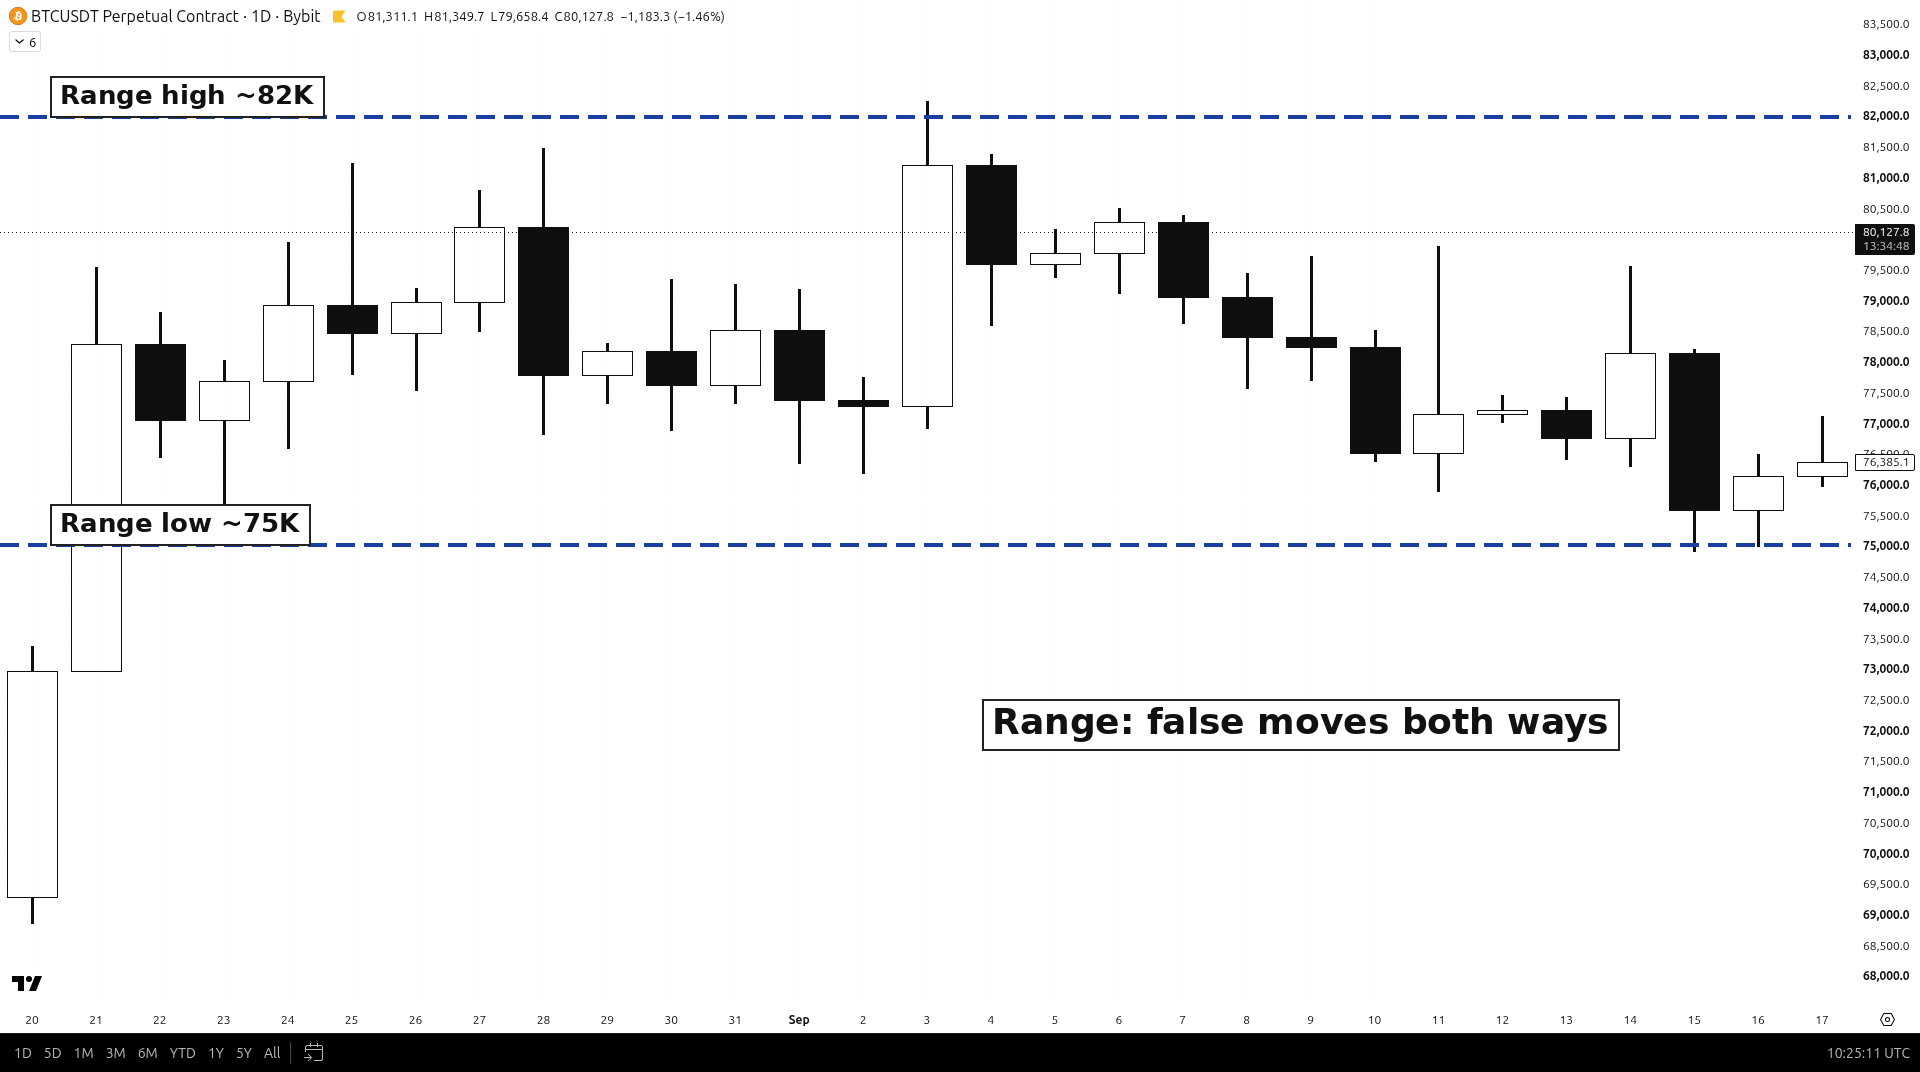
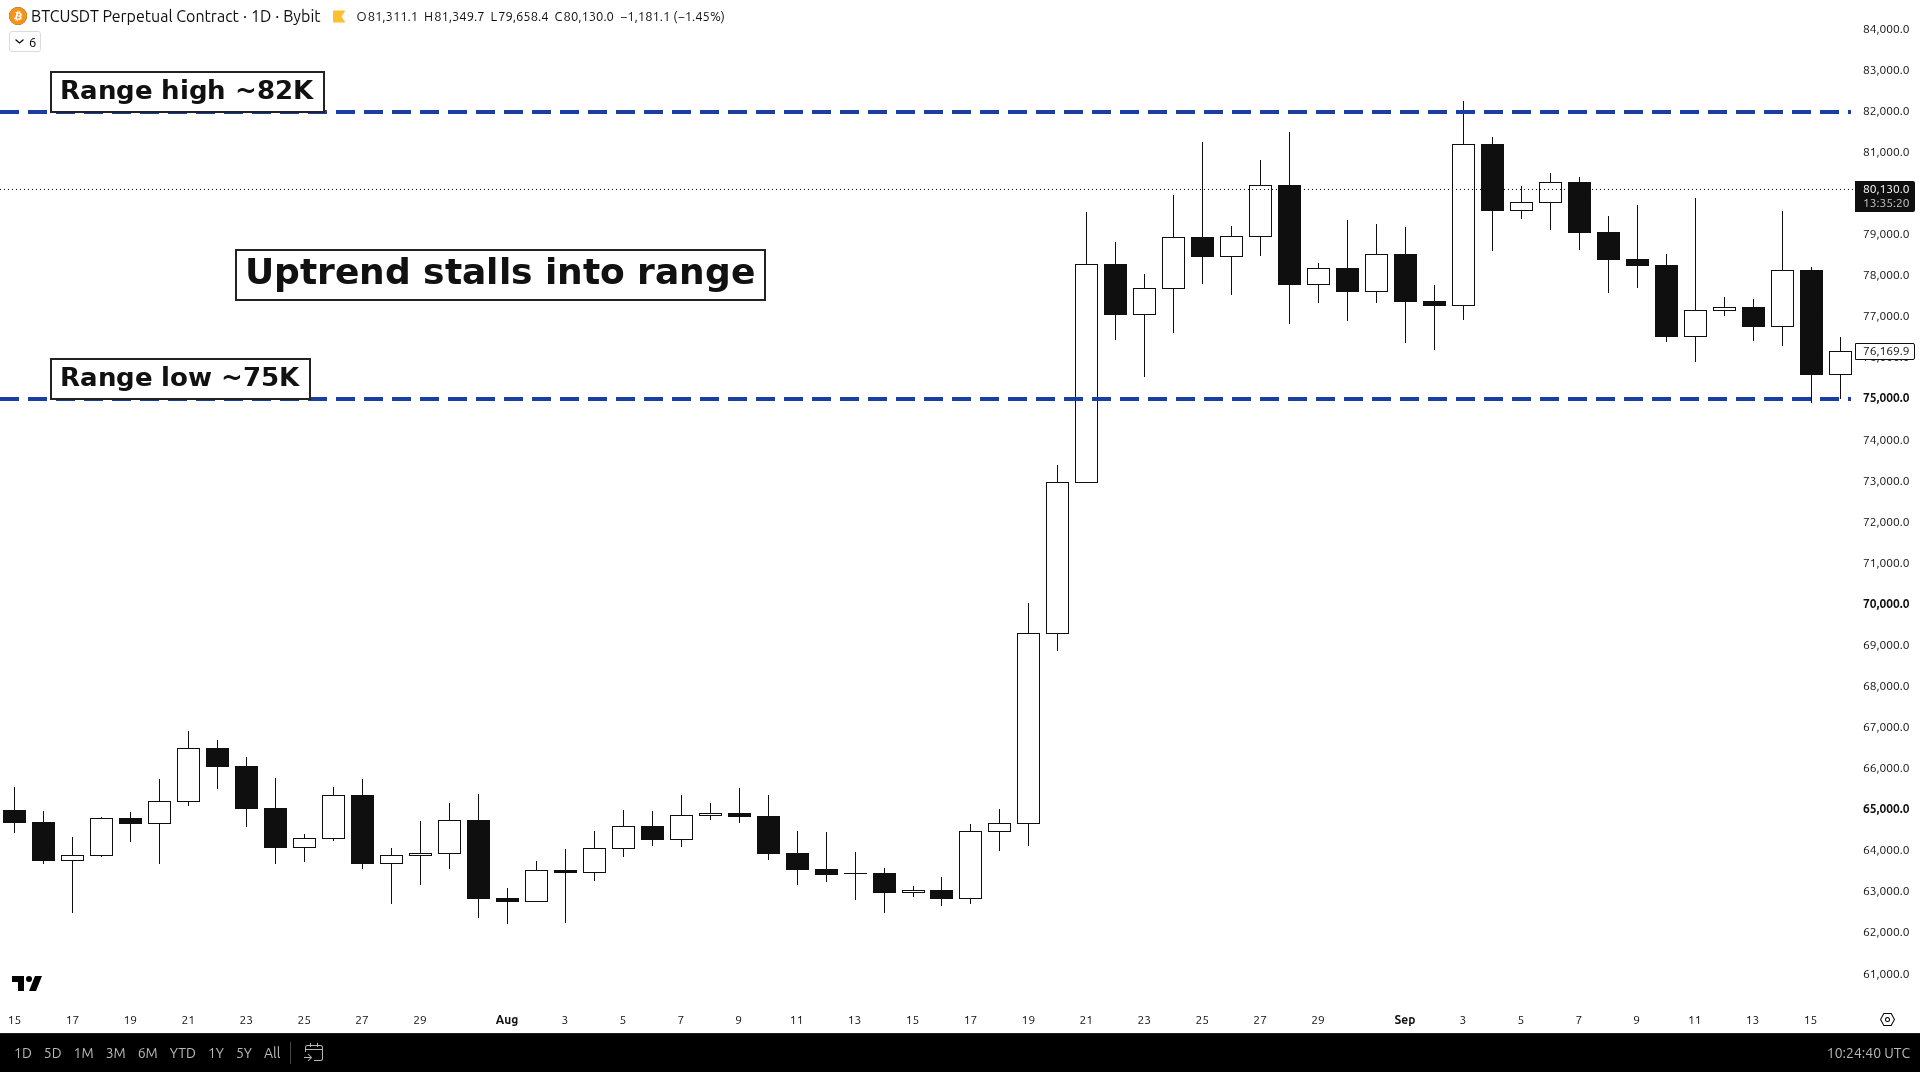
Mark the range and wait for the break
Here's the habit. When a trend stops, don't guess. Do this instead:
- Mark the range. Draw the high and the low of the sideways zone.
- Stay out of the middle. Buying dips or selling bounces in the middle of a range is where most of the chop happens.
- Use closes, not wicks. Wicks poking outside the range often just grab stops. A candle close beyond the range is what counts.
- Let the break give you the answer. A close out the top says the uptrend is likely continuing. A close out the bottom says it's likely reversing. Either way, you're reacting to what price did, not guessing what it might do.
This is the same idea as planning 3 paths before every trade: break up, break down, or keep ranging. You don't need to know which one ahead of time. You just need a plan for each, and a clear point where you know you're wrong.
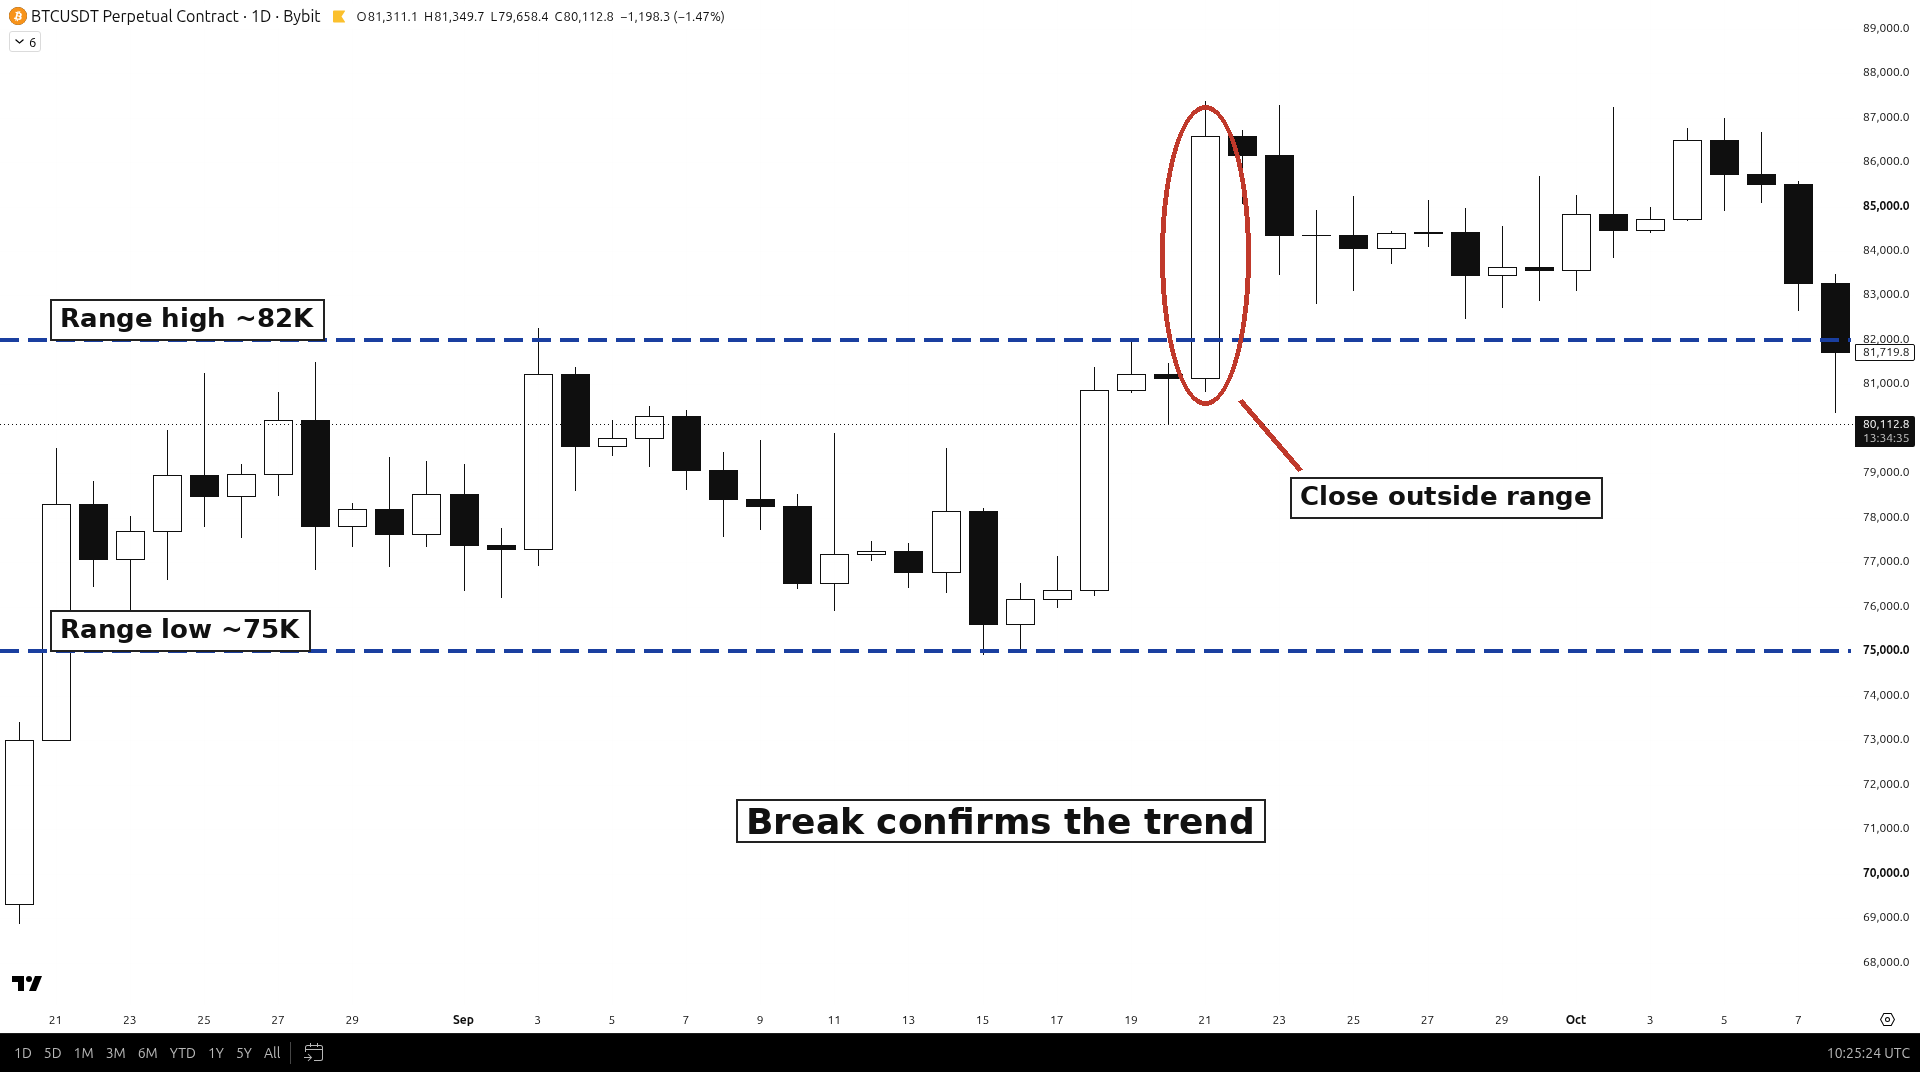
Quick recap
- Trends rarely flip straight away; they usually pause in a range first.
- The pause ends as re-accumulation (trend continues) or distribution (it reverses).
- Markets spend a lot of their time ranging.
- Inside the range, traders chasing each move get stopped out on both sides.
- Mark the range, avoid the middle, and wait for a close outside it.
Want to go back over the basics? Read Stop Predicting, Start Reading the Path and Why Price Action Comes First, or see every lesson on the daily lessons page.
You can practise marking ranges on any past chart for free on TradingView (affiliate link). Scroll back, find a trend that stalled, draw the range, then check which way it broke.
Educational only, not financial advice. Trading involves risk of loss. No profits are promised. Chart levels are approximate, from Bybit BTCUSDT perpetual daily candles. The TradingView link is an affiliate link.
← Previous lesson: The Four Phases Every Trader Must Recognise · Next lesson: see the full series →