That boring sideways range? It's setting up the next move.
In Day 17 we looked at what a buy wall in the order book can and can't tell you. Today we zoom out to the chart itself and look at something most traders find boring: price going sideways.
1. The range is the cause, the trend is the effect
When price moves sideways inside a box, it can feel like nothing is happening. It is. Buyers and sellers are both active, neither side is winning yet, and positions are being built on both sides of the box.
I think of it like this: the range is the cause, and the trend that eventually breaks out of it is the effect. You don't trade the boring part. You mark it, because it tells you where the next move is likely to start from.
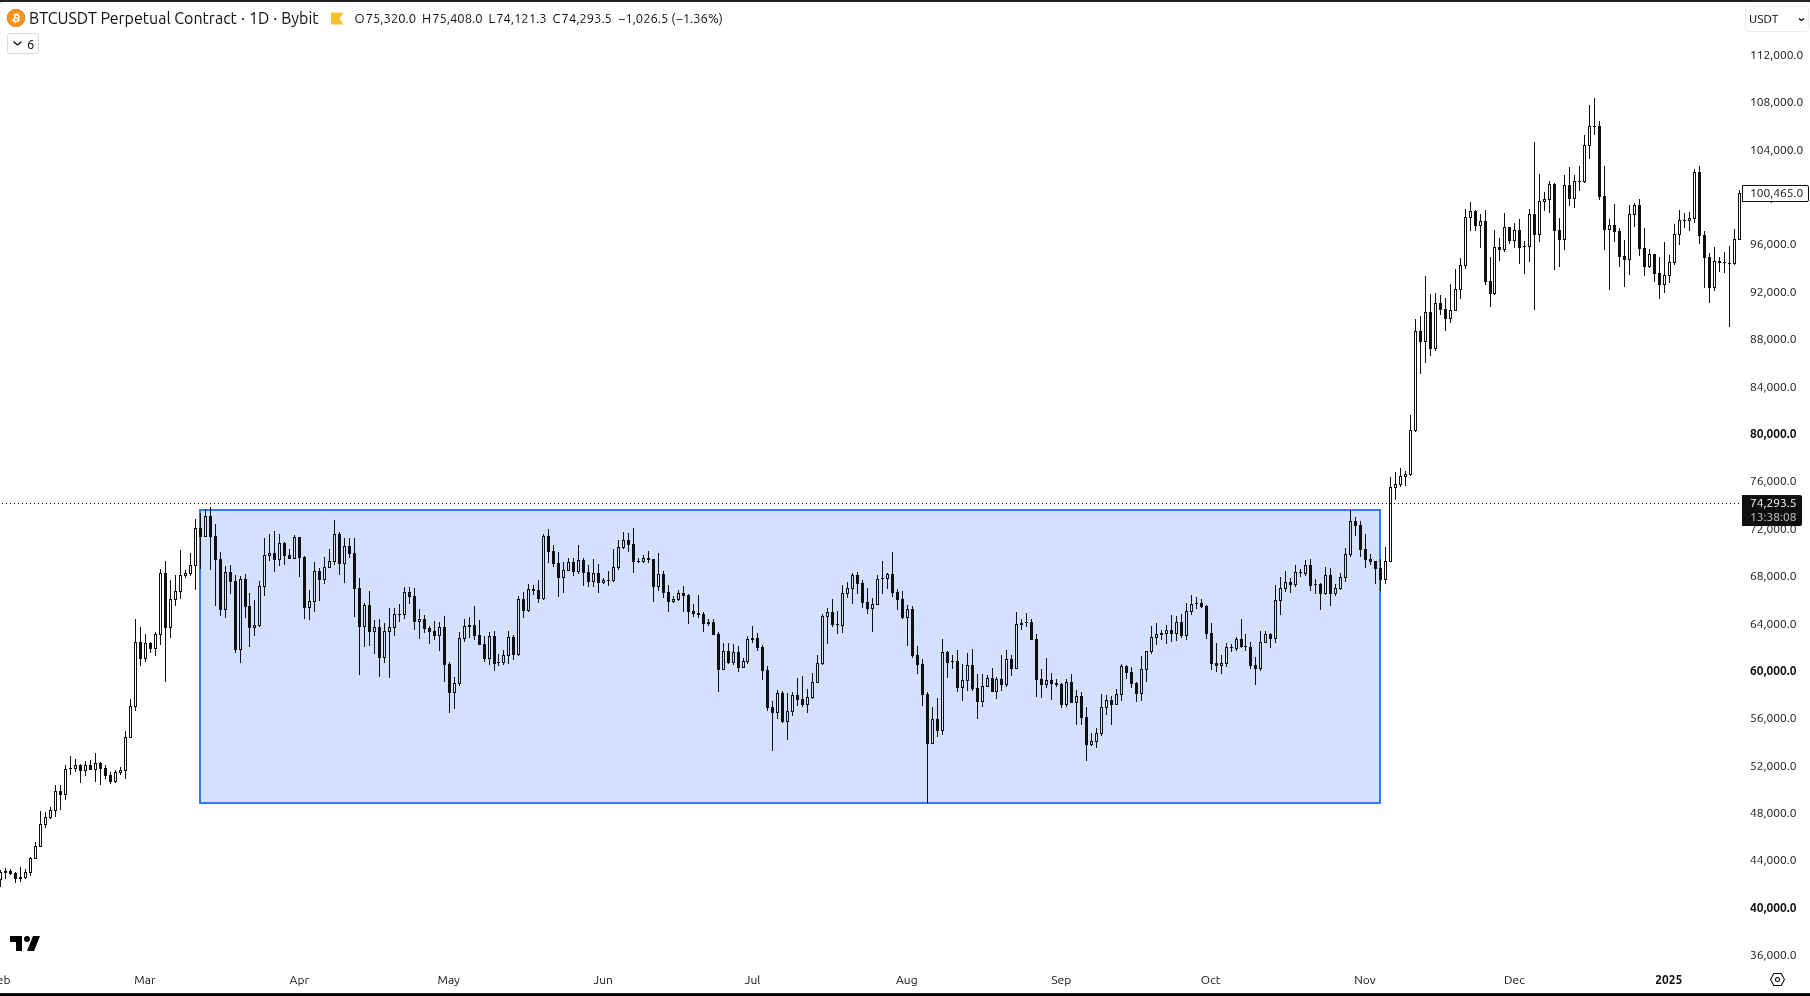
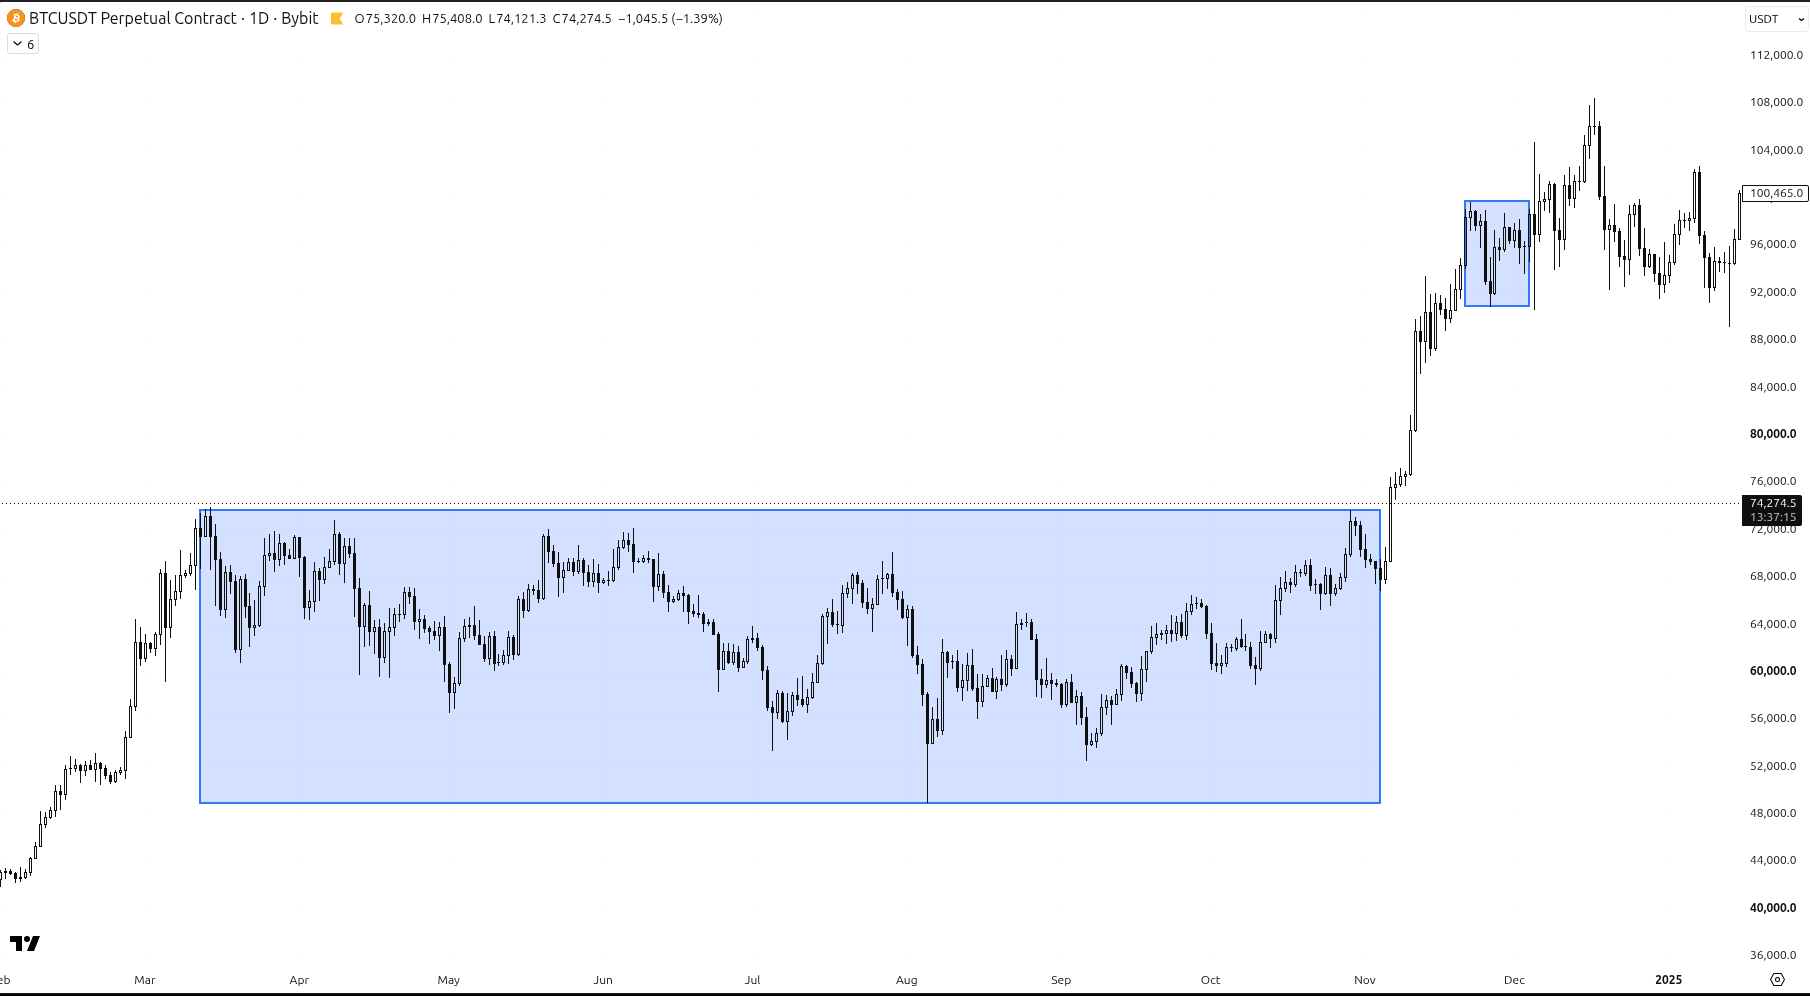
A long sideways range on the BTCUSDT daily chart, then the trend that broke out of it. Bybit perpetual, 1D.
2. Why a longer range often means a bigger move
The longer price stays stuck in a box, the more traders build positions inside it. Some buy the bottom of the range, some sell the top, some place stops just outside it.
When the range finally breaks, a lot of those traders have to react at the same time. Some are wrong and need to get out, others chase the break. That is why the move out of a long range often travels further than people expect.
On the chart above, price spent months going sideways. When it broke out, the trend that followed was much bigger than any swing inside the box.
3. A short range usually gives a short move
The same idea works in reverse. A range that only lasts a few days or weeks hasn't built up much, so the move out of it is usually smaller.
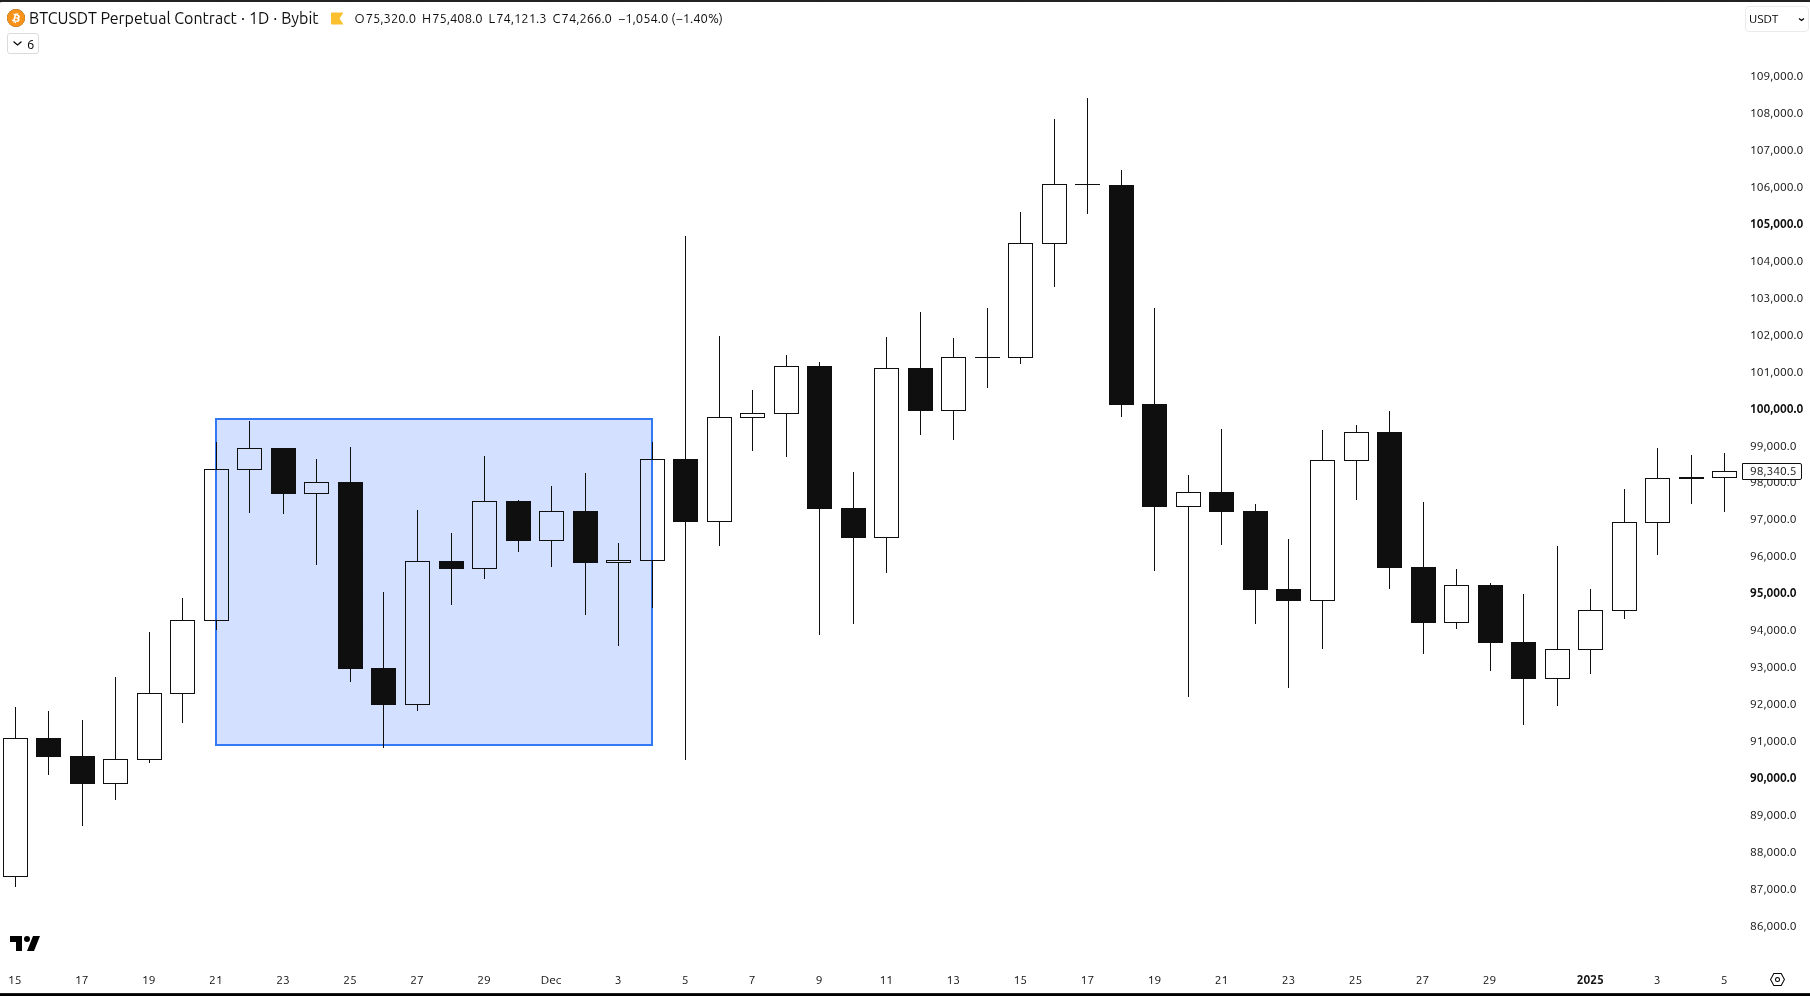
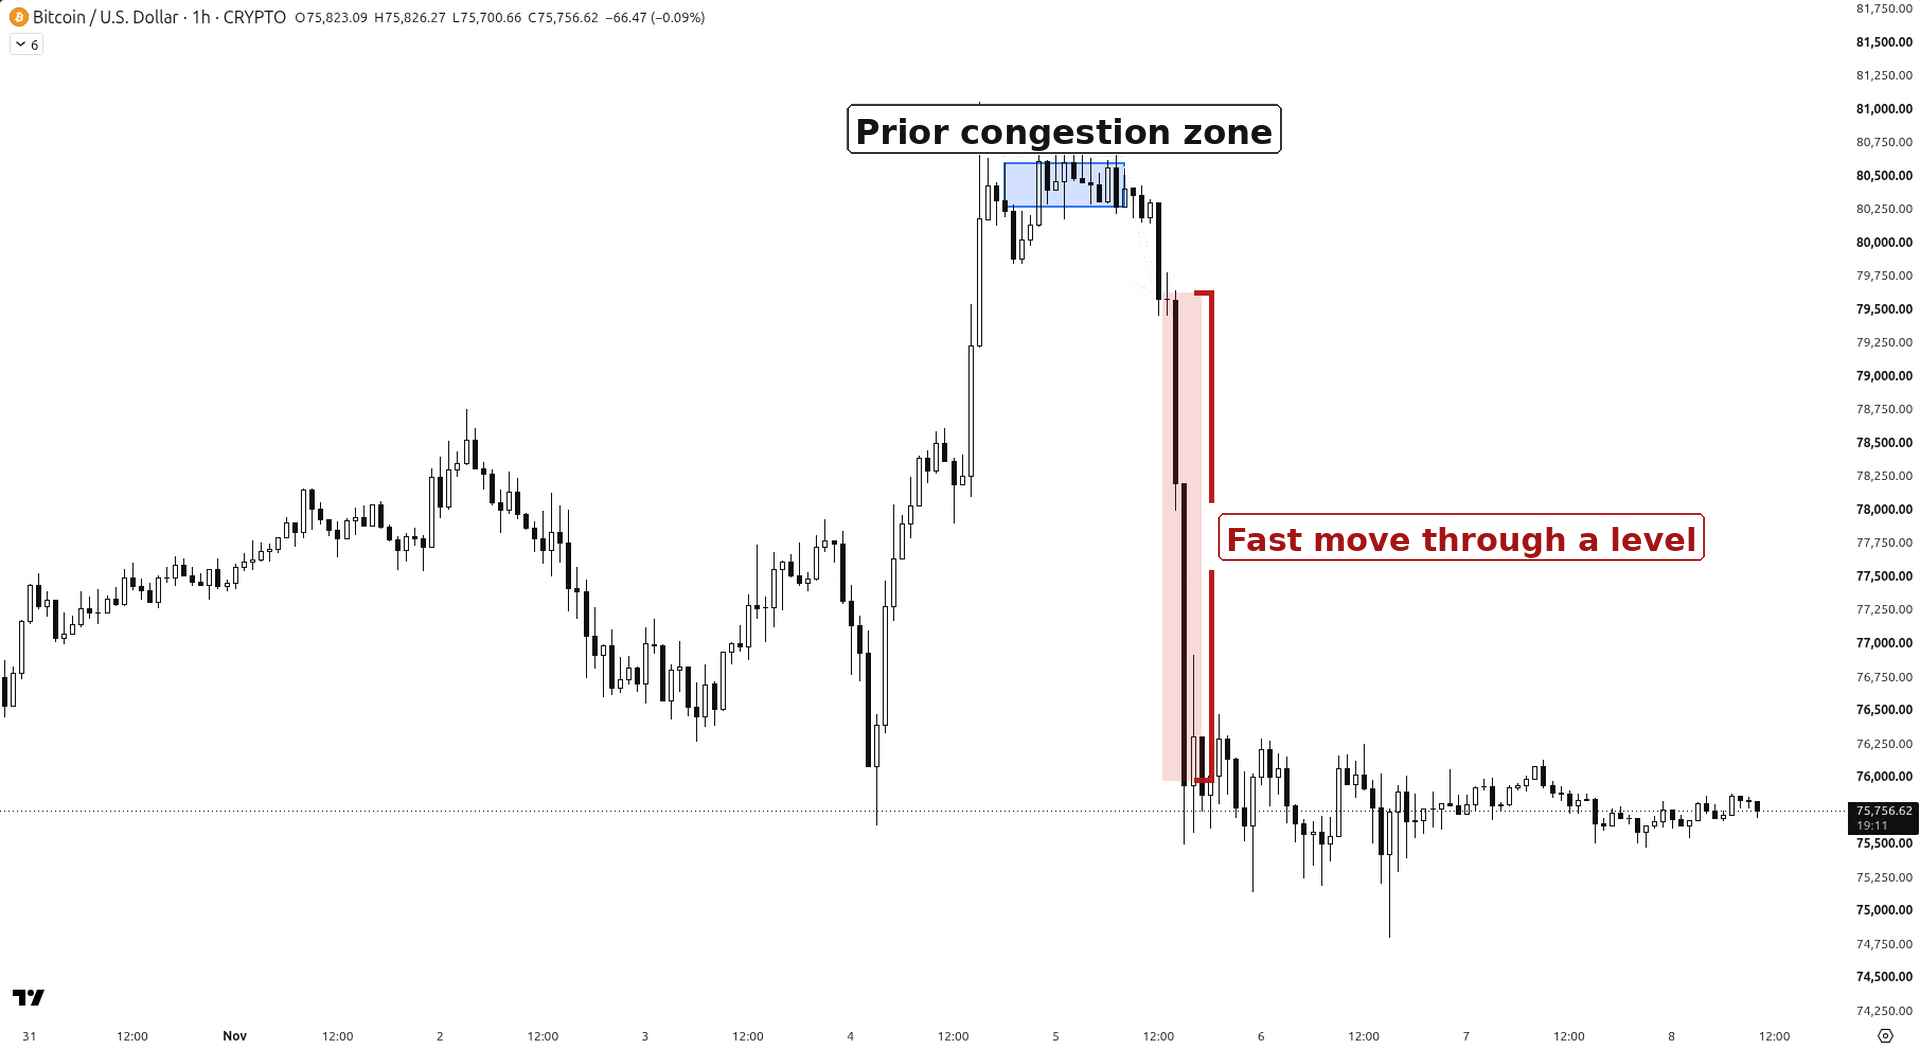
A short range of about two weeks. The break from it carried for a while, then faded. Bybit perpetual, 1D.
Put both on one chart and the difference is easy to see: the long box led to the big trend, the small box near the top led to a much smaller push.
This is a tendency, not a rule. A long range does not guarantee a big move, and it doesn't tell you the direction in advance.
4. Use the right timeframe
Ranges are cleaner on the 4-hour and daily charts. On very small timeframes almost everything looks like a range, and quiet weekend ranges are mostly noise: fewer people are trading, so the box doesn't mean much.
5. Don't fight the range, mark it
So next time you see a long range, don't fight it. Draw the box around the highs and lows, then wait for price to break out of it. Then judge the break with your normal plan and risk rules, the same way we did with plan 3 paths.
Mark the box. Wait for the break.
← Previous: Day 17: How Order Books Really Work · Next: Day 19 (coming soon) · Browse all daily lessons
Educational only, not financial advice. Trading involves risk of loss. No profits are promised.