After the sell-off, gold closed above a steep downtrend line. That was a reason to reassess—not proof of a reversal.
In Day 15 we looked at a reclaim around a horizontal level. Today, use a gold chart to look at a steep downtrend line and why what price does next matters more than the line alone.
1. Start with a clear impulse
On the OANDA:XAUUSD 1-hour chart, gold sold off into a low around end of October. Start with that clear impulse rather than forcing a trendline through sideways noise.
The steep downtrend line follows the structure of that sell-off. Keep the older, shallower line drawn before the break on the chart too. It provides context for the later rally, rather than a destination price must reach.
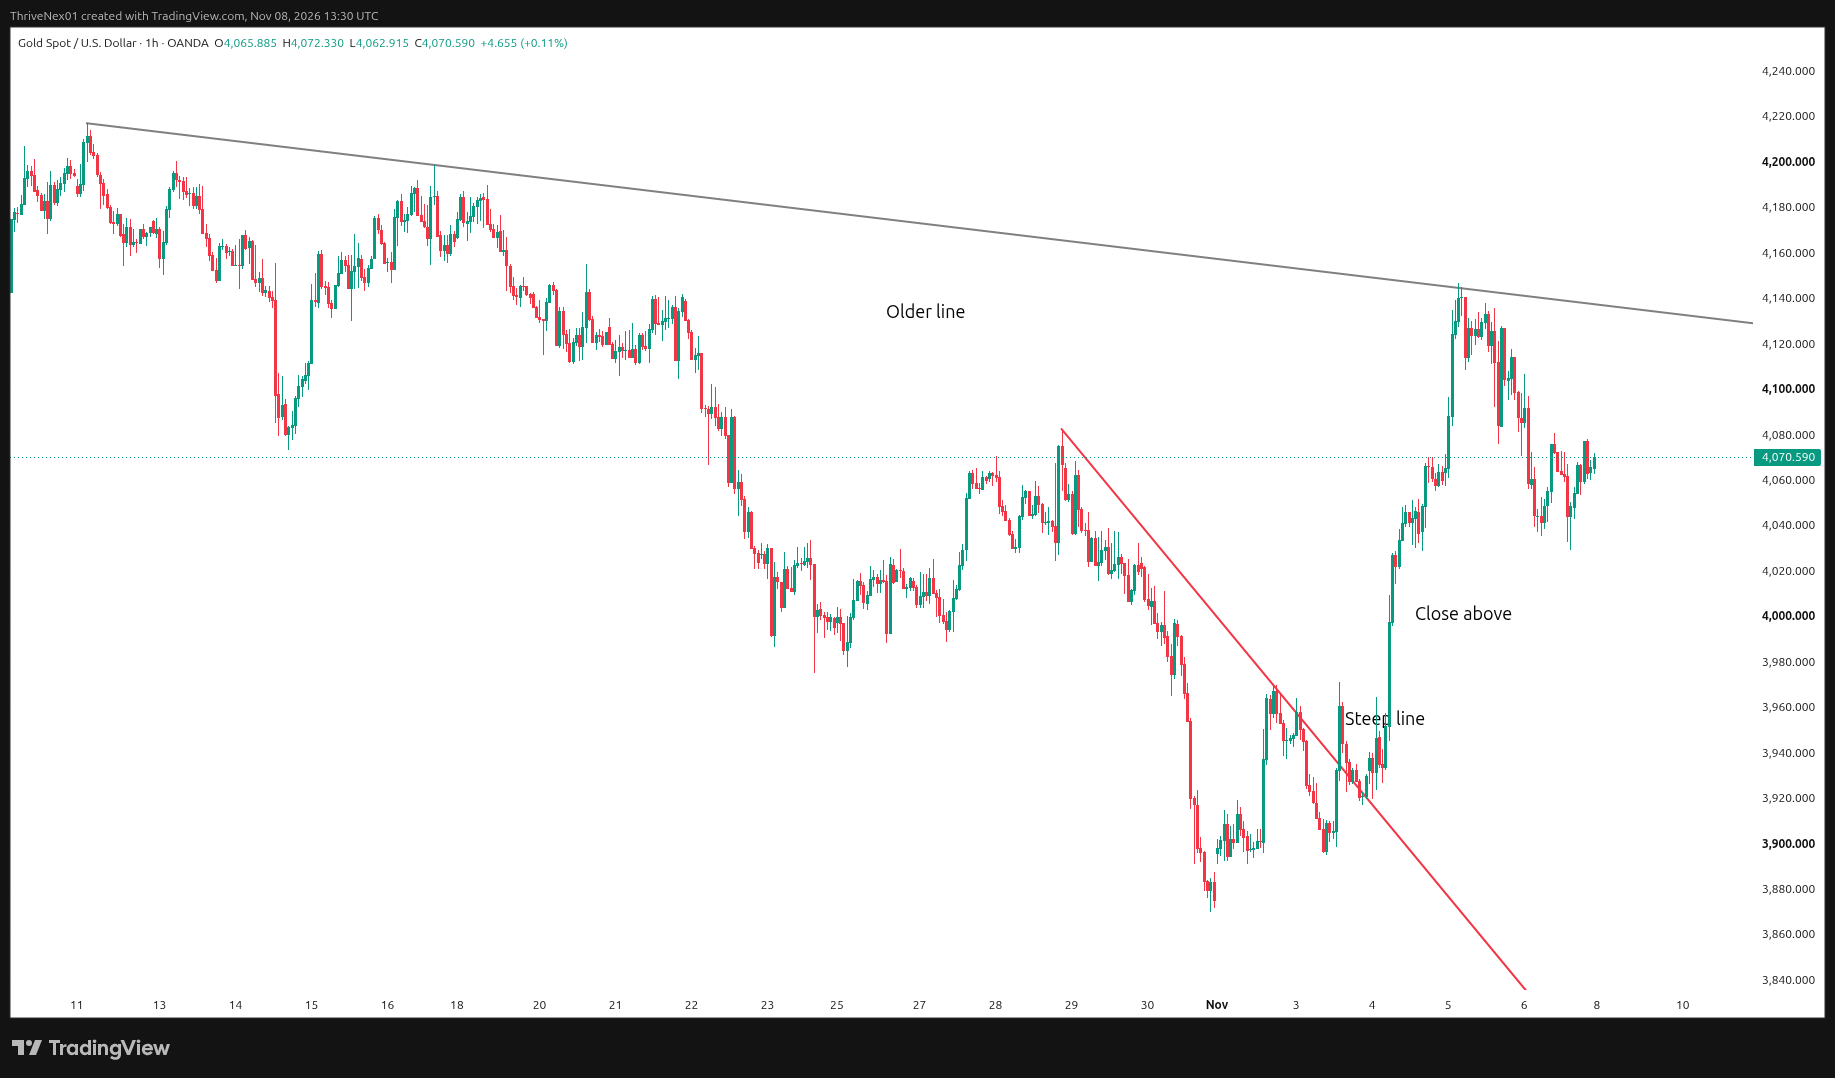
The sell-off and the older, shallower line provide the wider context. OANDA:XAUUSD, 1h, UTC.
2. A close above is a reason to reassess
After the sell-off, gold closed above the steep downtrend line. That gave a reason to reassess the downward move, but it did not prove a reversal.
A line describes the slope of a move. A close through it is something to evaluate alongside the following price action, not an instruction to enter, exit or reverse a position.
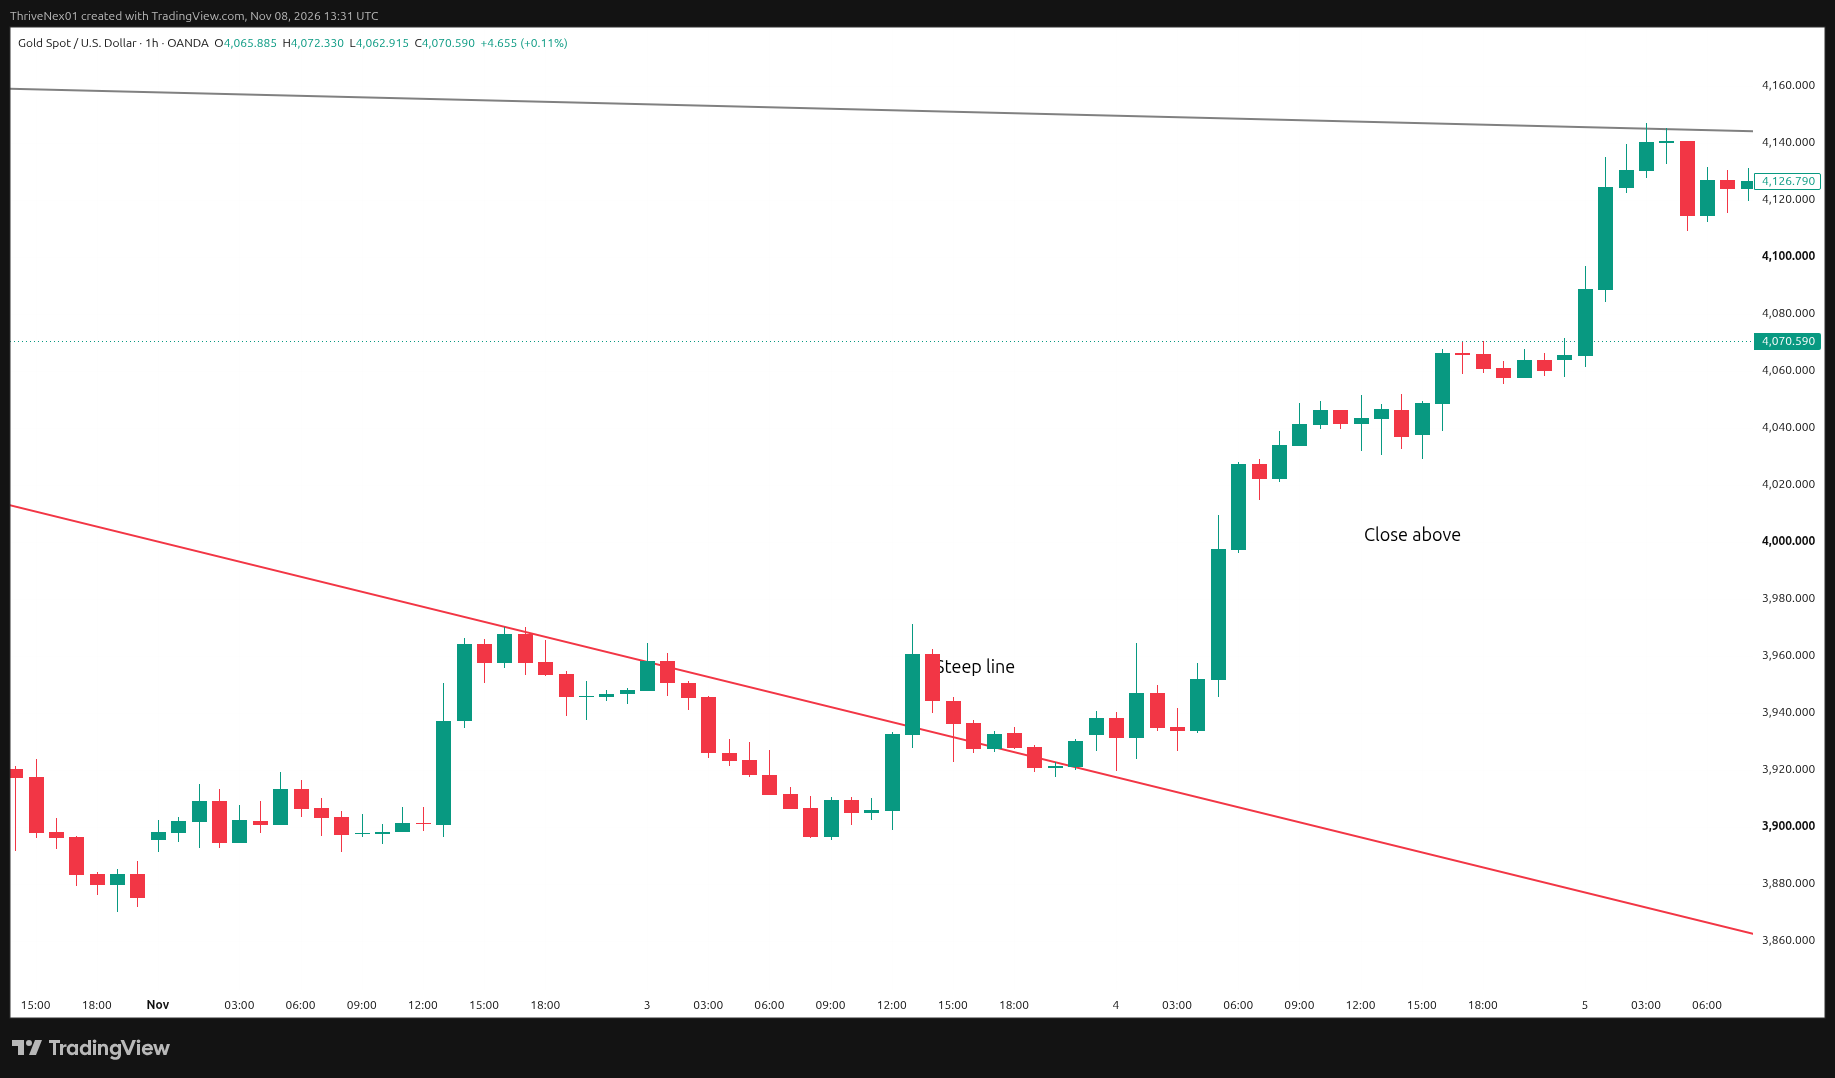
Watch the close through the steep line, then assess what price does next. OANDA:XAUUSD, 1h, UTC.
3. Keep the older, shallower line as context
Price later rallied toward the older, shallower line drawn before the break. It was another area to watch, not a promised target.
The later rally does not mean a steep-line break tells you where price will go. Keep the distinction between a reference on the chart and a prediction.
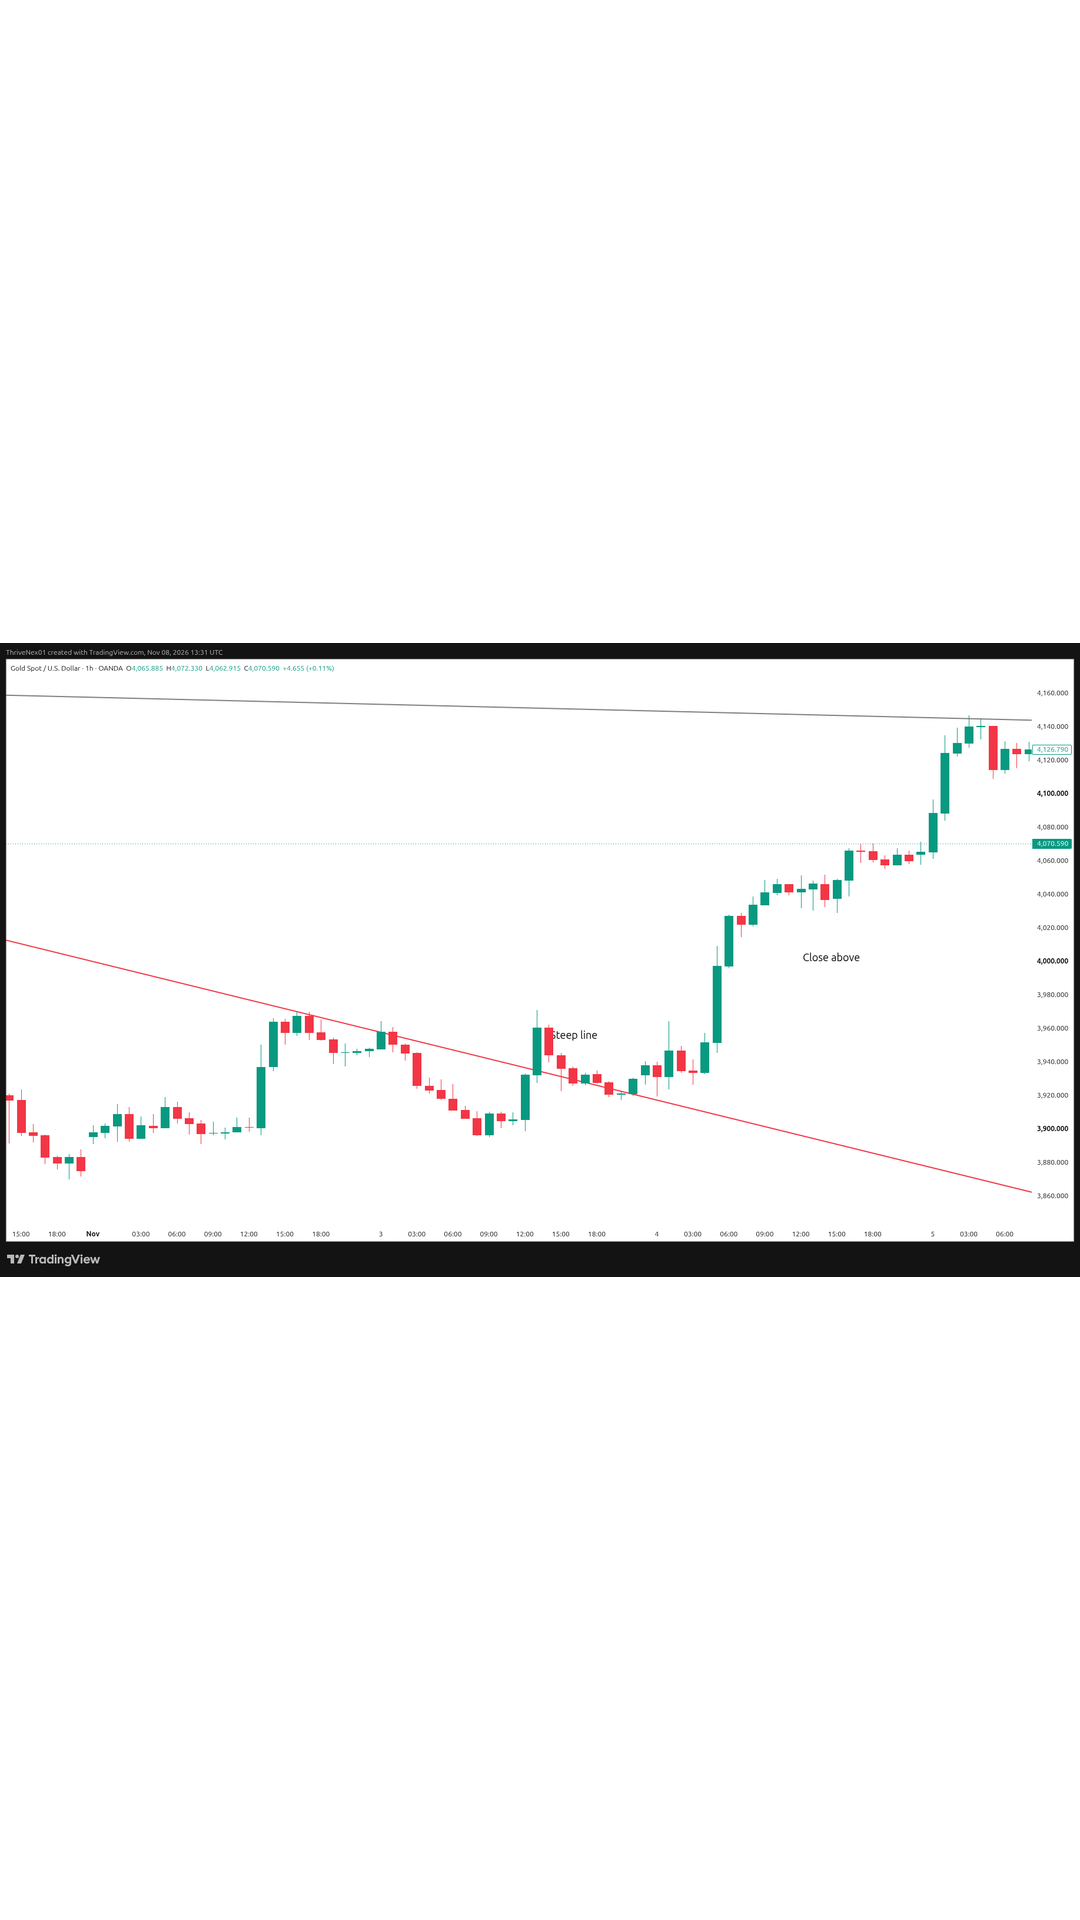
The sequence: sell-off, close above the steep line, then a rally toward the older, shallower line. OANDA:XAUUSD, 1h, UTC.
How I use it
Use three questions to keep the line in context:
- Is there a clear impulse behind the line, rather than sideways noise?
- Has price closed through the steep line, and what does price do next?
- Am I treating the older, shallower line as an area to watch rather than a promised target?
As always, plan 3 paths: price can continue higher, move back below the steep line, or consolidate. If you have a position, manage it according to your existing plan and risk rules. The line alone is not an instruction to enter, exit or reverse.
Quick recap
- Start with a clear impulse before drawing the line.
- A close above the steep downtrend line is a reason to reassess, not proof of a reversal.
- The older, shallower line drawn before the break is another area to watch, not a target.
- Use what price does next—not the line alone.
New to the series? Start with Why Price Action Comes First, catch up on Market Structure Explained Simply and Finding the Level That Actually Matters, or see every lesson on the daily lessons page.
We use TradingView for every chart on this site. If you want the same setup, you can try TradingView here (affiliate link, we may earn a small commission at no extra cost to you).
← Previous: Day 15: A Cleaner Alternative to Head & Shoulders · Next: Day 17: How Order Books Really Work
Educational only, not financial advice. Trading involves risk of loss. No profits are promised.