Big volume, tiny candle? That's a warning.
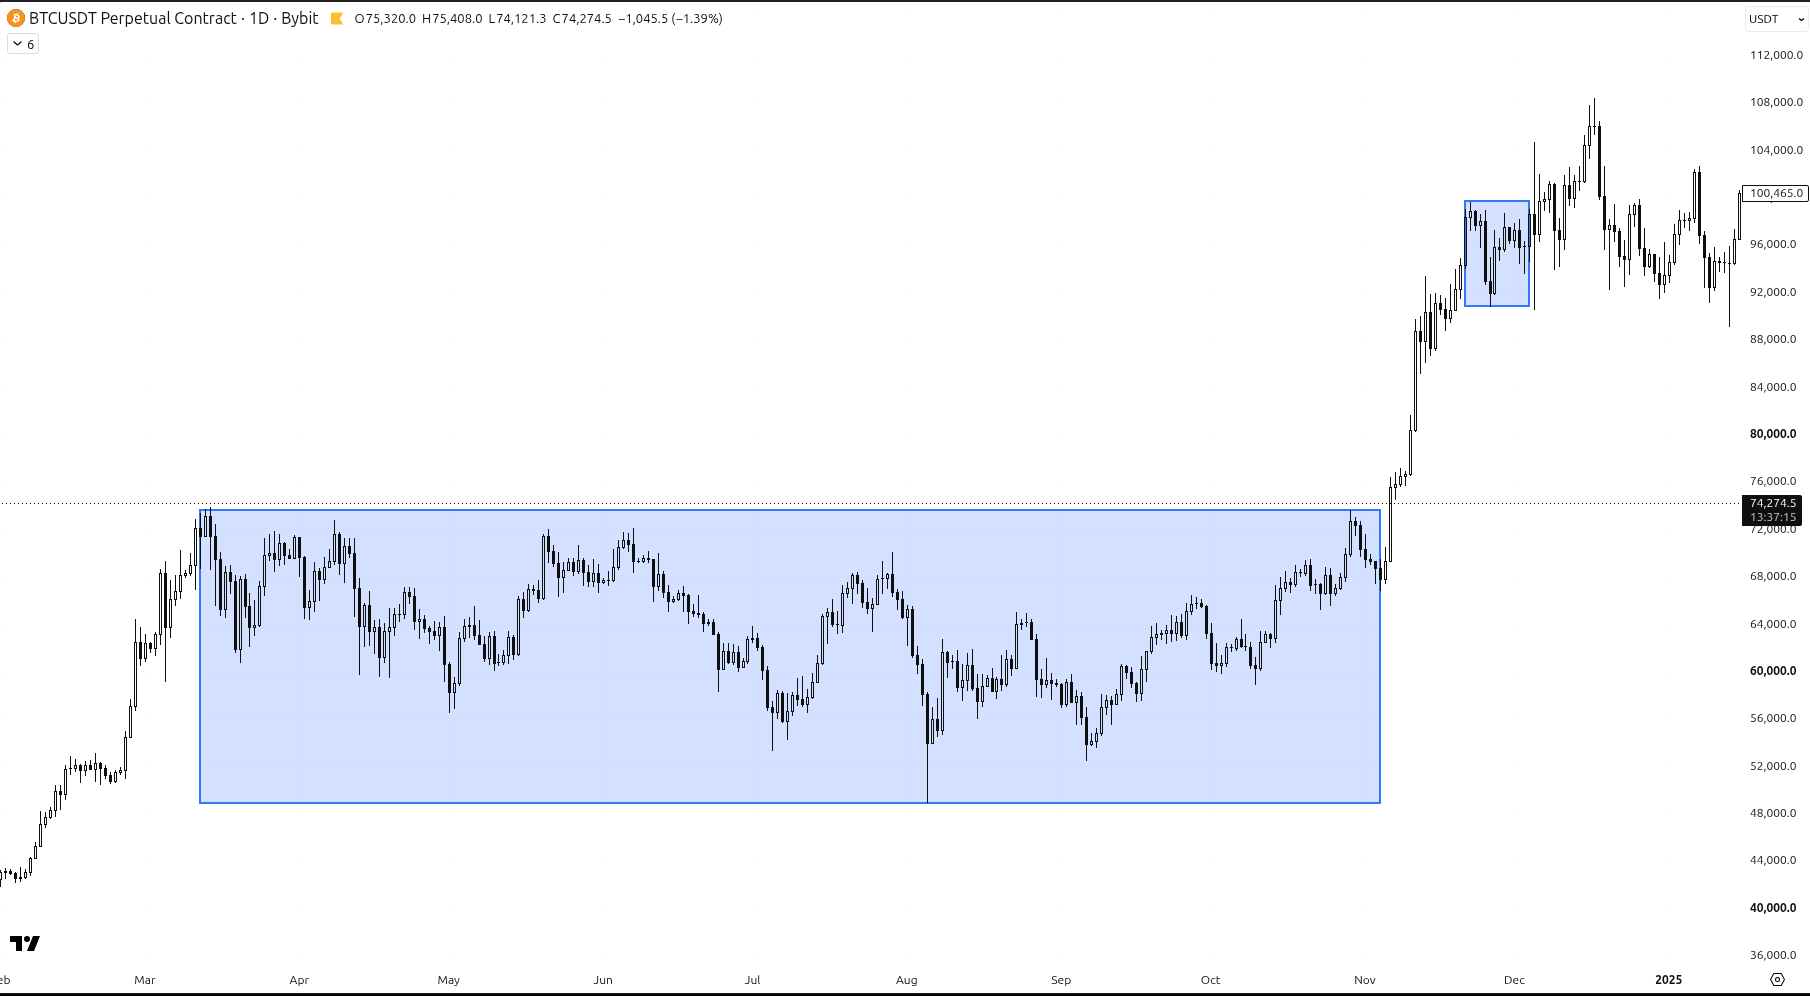
In Day 18 we looked at how long sideways ranges build up the next move. Today we add the bars under the chart that most beginners ignore: volume.
1. Volume is the effort, the candle is the result
Every candle tells you how far price moved. The volume bar under it tells you how much trading it took to get there.
I think of it like this: volume is the effort, and the candle body is the result. When the two agree, the move is healthy. A big push on big volume, or a quiet drift on quiet volume, makes sense.
The interesting part is when they don't agree.
2. Big effort, small result
Sometimes you see one of the tallest volume bars in weeks, and the candle above it barely closes away from where it opened. A lot of trading happened, but price went almost nowhere.
That usually means someone was on the other side, soaking up the buying or the selling. Traders kept pushing, and someone, often a bigger player, kept filling their orders from the other side. The move used a lot of fuel and didn't get far.
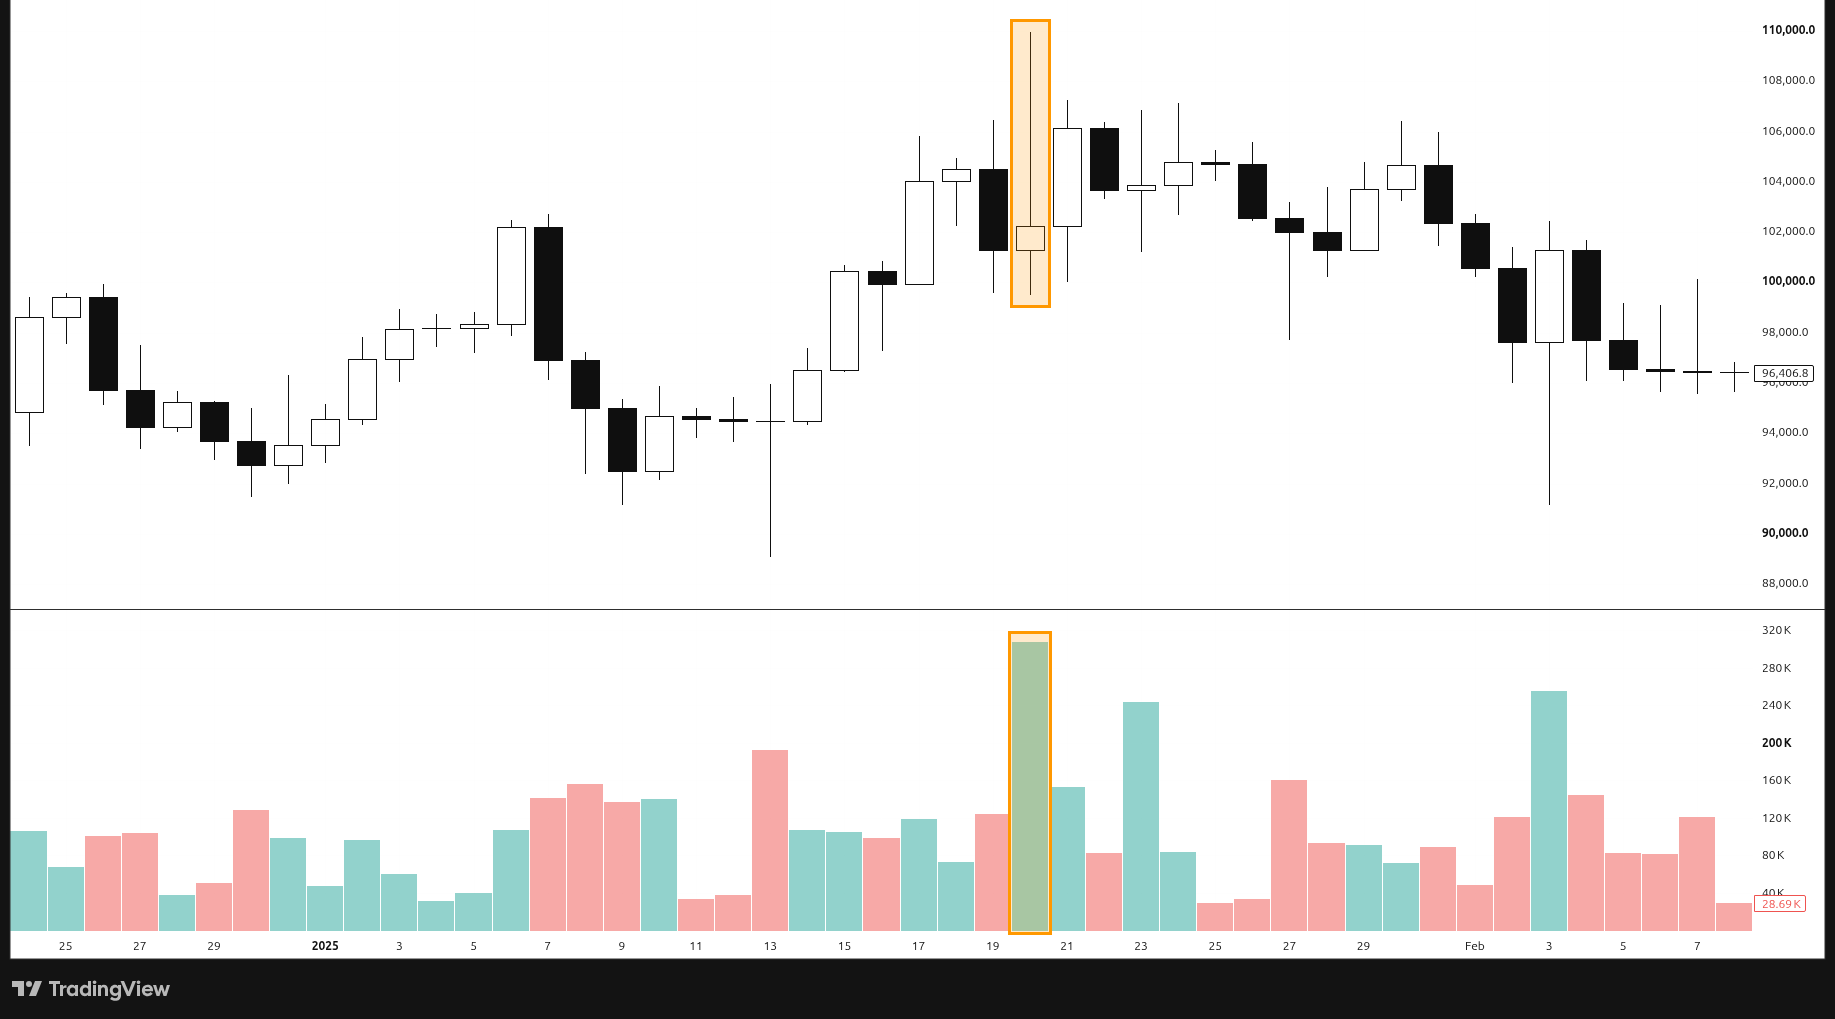
BTCUSDT perpetual, daily, Bybit. On 20 Jan 2025 the volume bar was roughly twice the size of the days around it. Price spiked to around 110K during the day, but the candle opened near 101K and closed near 102K, so the body was tiny.
3. What happened next
Bitcoin had been climbing into that day. After the heavy-volume, small-body candle, price bounced for a few days, then stalled under the high and drifted lower. Within about two weeks it was back around 96-97K and stayed stuck there into late February, before a much bigger drop.
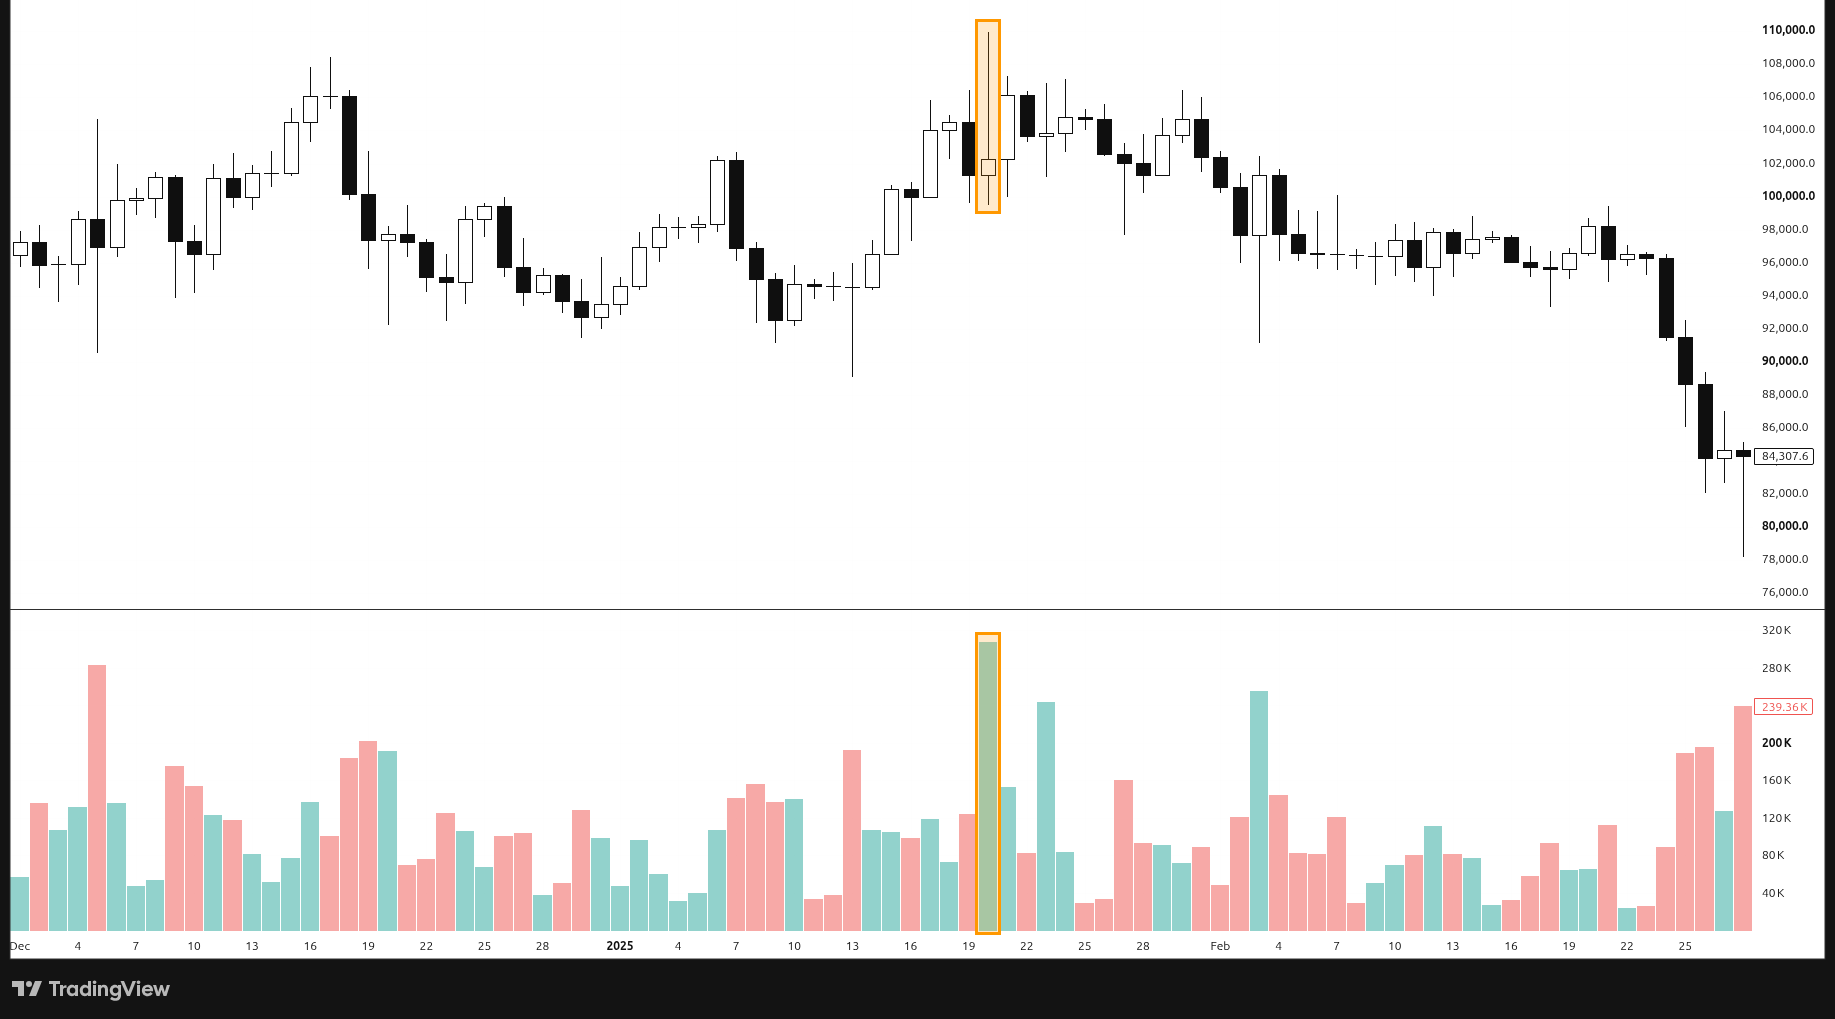
The wider view: the climb, the big-volume candle near the top, and the stall that followed. Bybit perpetual, 1D.
This is a tendency, not a rule. A big-volume, small-body candle does not always mean a reversal. Sometimes price pauses and then keeps going. It tells you the move is meeting resistance, not what happens next.
4. Where it matters most
This signal means the most at the end of a strong move and at a level you already care about, like a range high, a previous top, or a big round number. In the middle of a choppy range, a big volume bar is often just noise.
It also works on the way down. A heavy-volume candle that barely closes lower after a sharp sell-off can mean buyers are absorbing the selling.
5. A warning, not an entry
Don't sell or buy just because you see one of these candles. Treat it as a warning light. If you're already in a trade, it's a reason to tighten your plan. If you're waiting to enter, it's a reason to wait for price to confirm, the same way we planned for three outcomes in plan 3 paths.
Watch the effort. Judge the result.
← Previous: Day 18: Why Long Consolidations Lead to Big Moves · Next: Day 20 (coming soon) · Browse all daily lessons
Educational only, not financial advice. Trading involves risk of loss. No profits are promised.