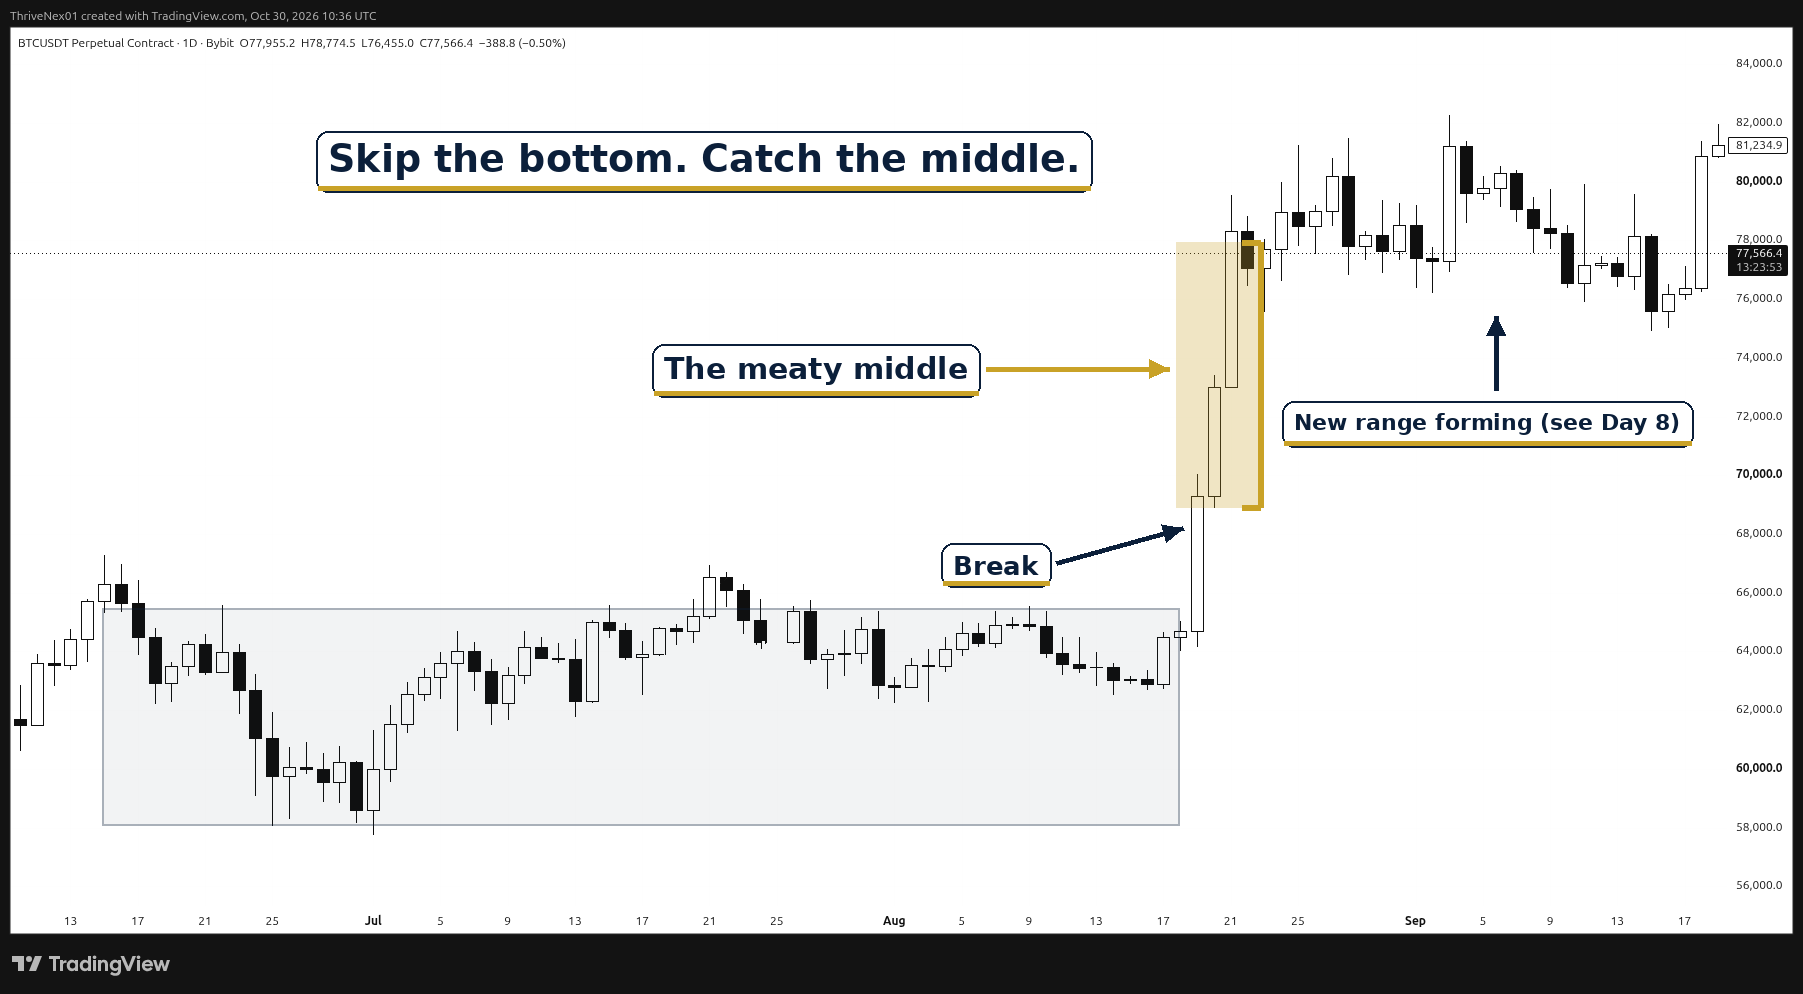
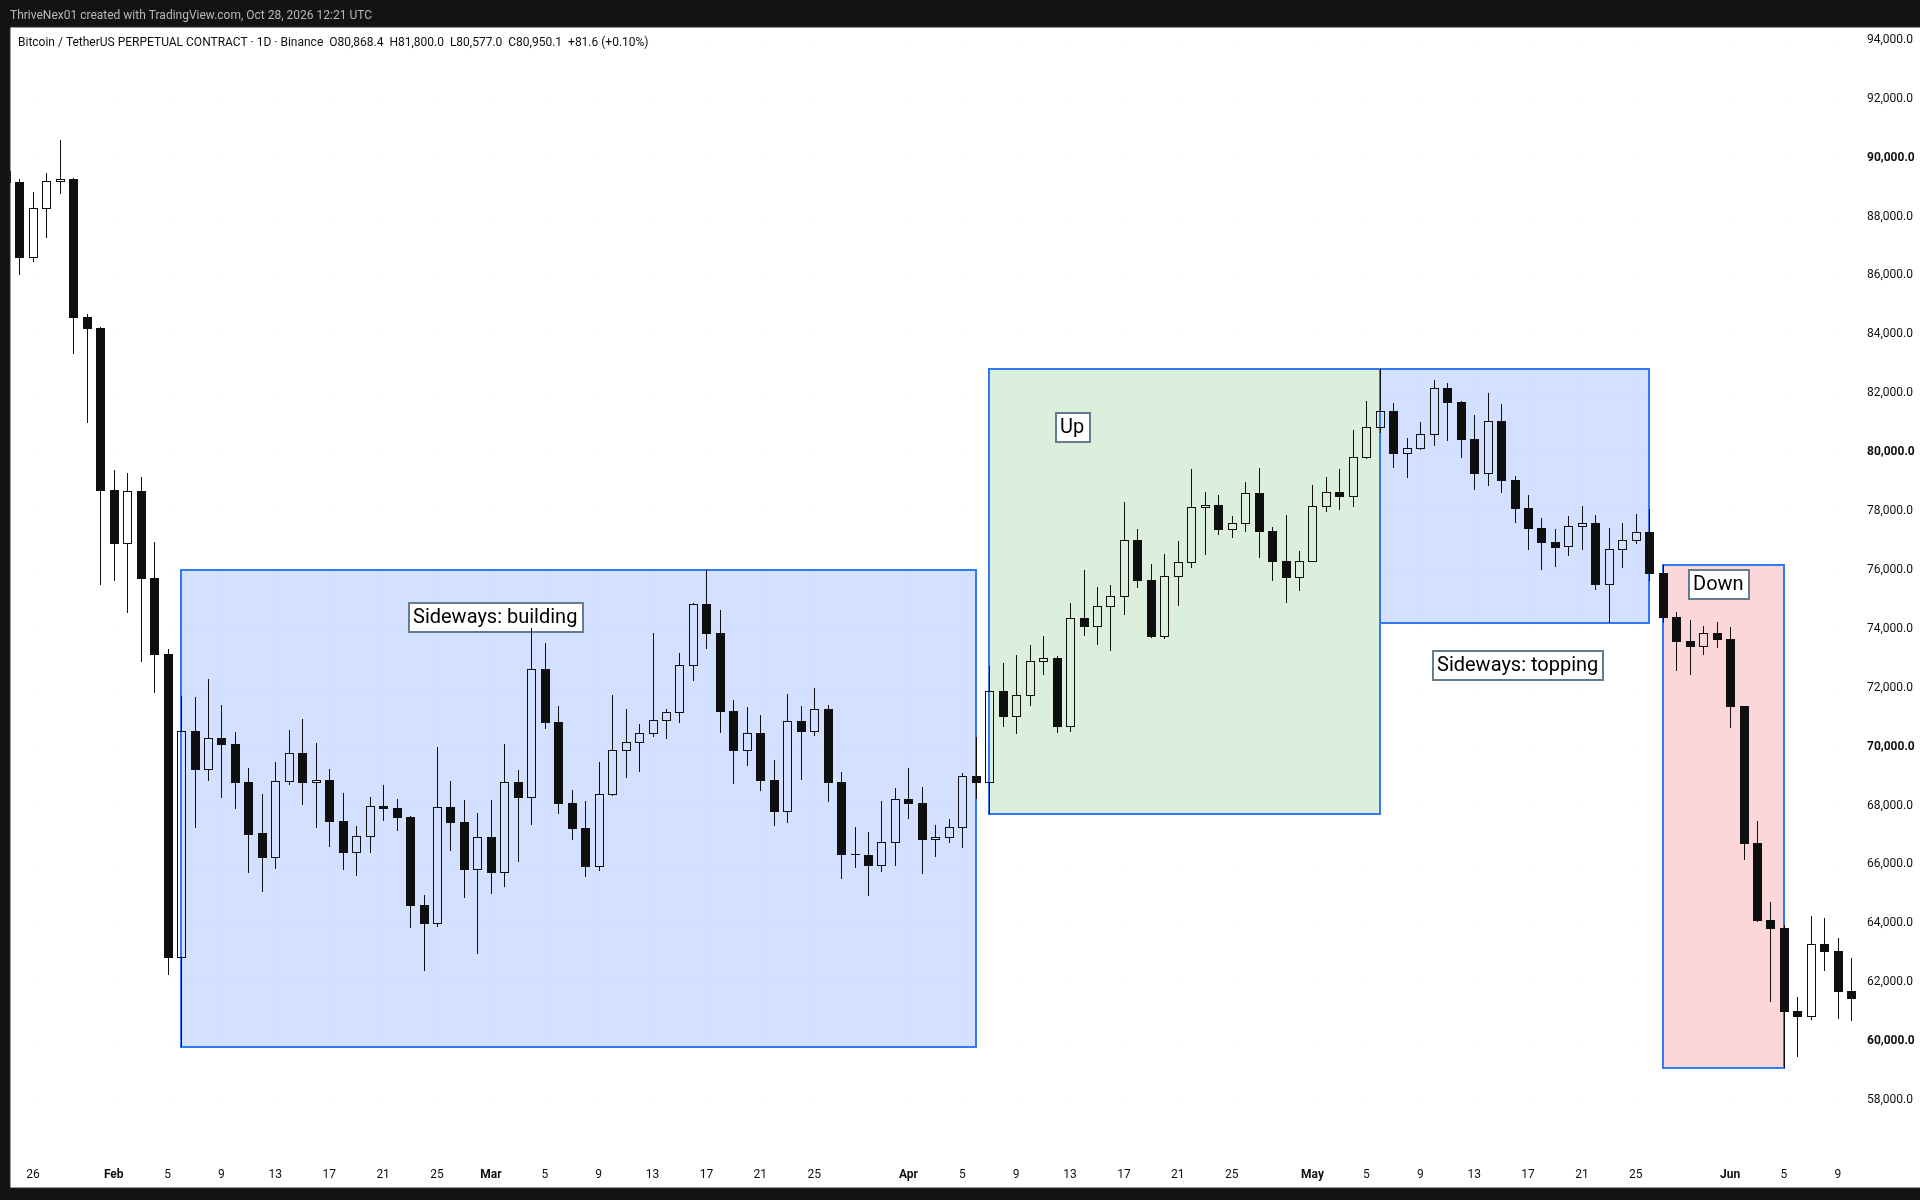
Most of the time, the market isn't trending. It's going sideways.
Charts in videos and screenshots love the big moves: the breakout, the crash, the clean trend. But if you zoom out, you see something less exciting. A few sharp trends, and long stretches where price just bounces between two levels. Those stretches are ranges, and learning to trade them is one of the most underrated skills a beginner can build.
Zoom out: trends are short, ranges are long
Look at the last year of Bitcoin on the daily chart. We shaded the sideways blocks in grey and the trend legs in green. The trends (the drop into early February, the spring rally, the May–June drop, the August breakout and the September push) were fast. The ranges in between lasted weeks to months.
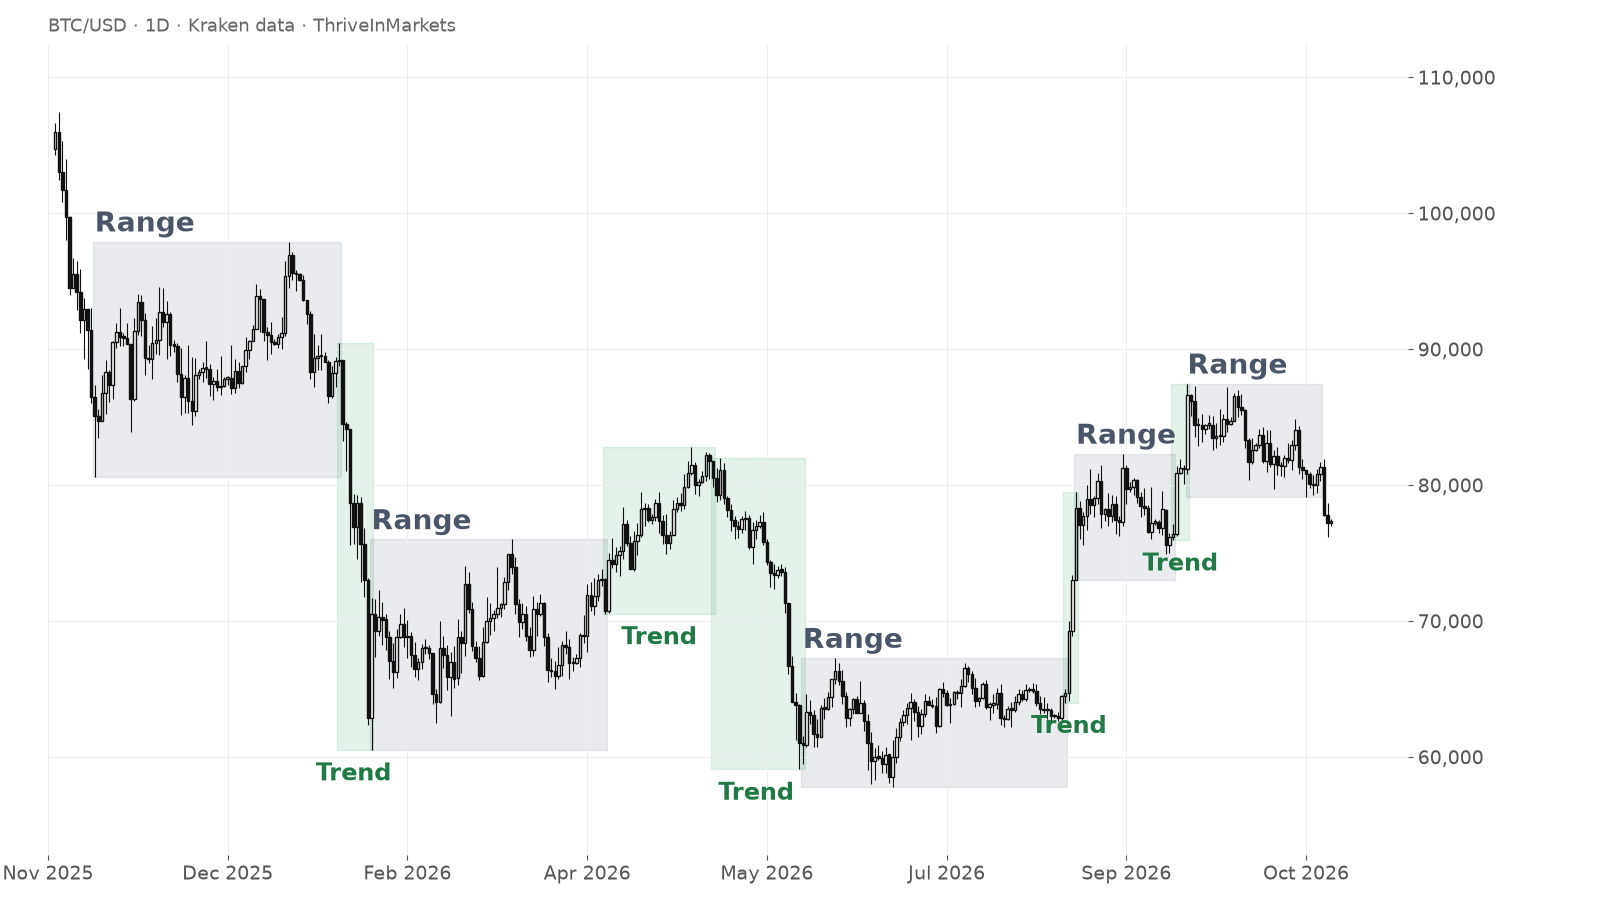
By our own marking on this chart, most of the days sat inside one of the grey boxes. That's one chart and one year, not a law of the market, but it's a pattern you'll see again and again once you start looking. If you only know how to trade trends, you spend a lot of your time waiting, or worse, forcing trend trades in a market that's going nowhere.
In Day 8 we saw that trends usually pause in a range before they turn. And in Day 9 we learned how to follow a trend once it breaks out. Today is the other half: what to do while price is still in the box.
An early clue: the very deep pullback
In a healthy trend, pullbacks are shallow. When a pullback gives back about three-quarters or more of the move before it (on a closing basis), that's a warning that the trend has lost its push and a range may be starting.
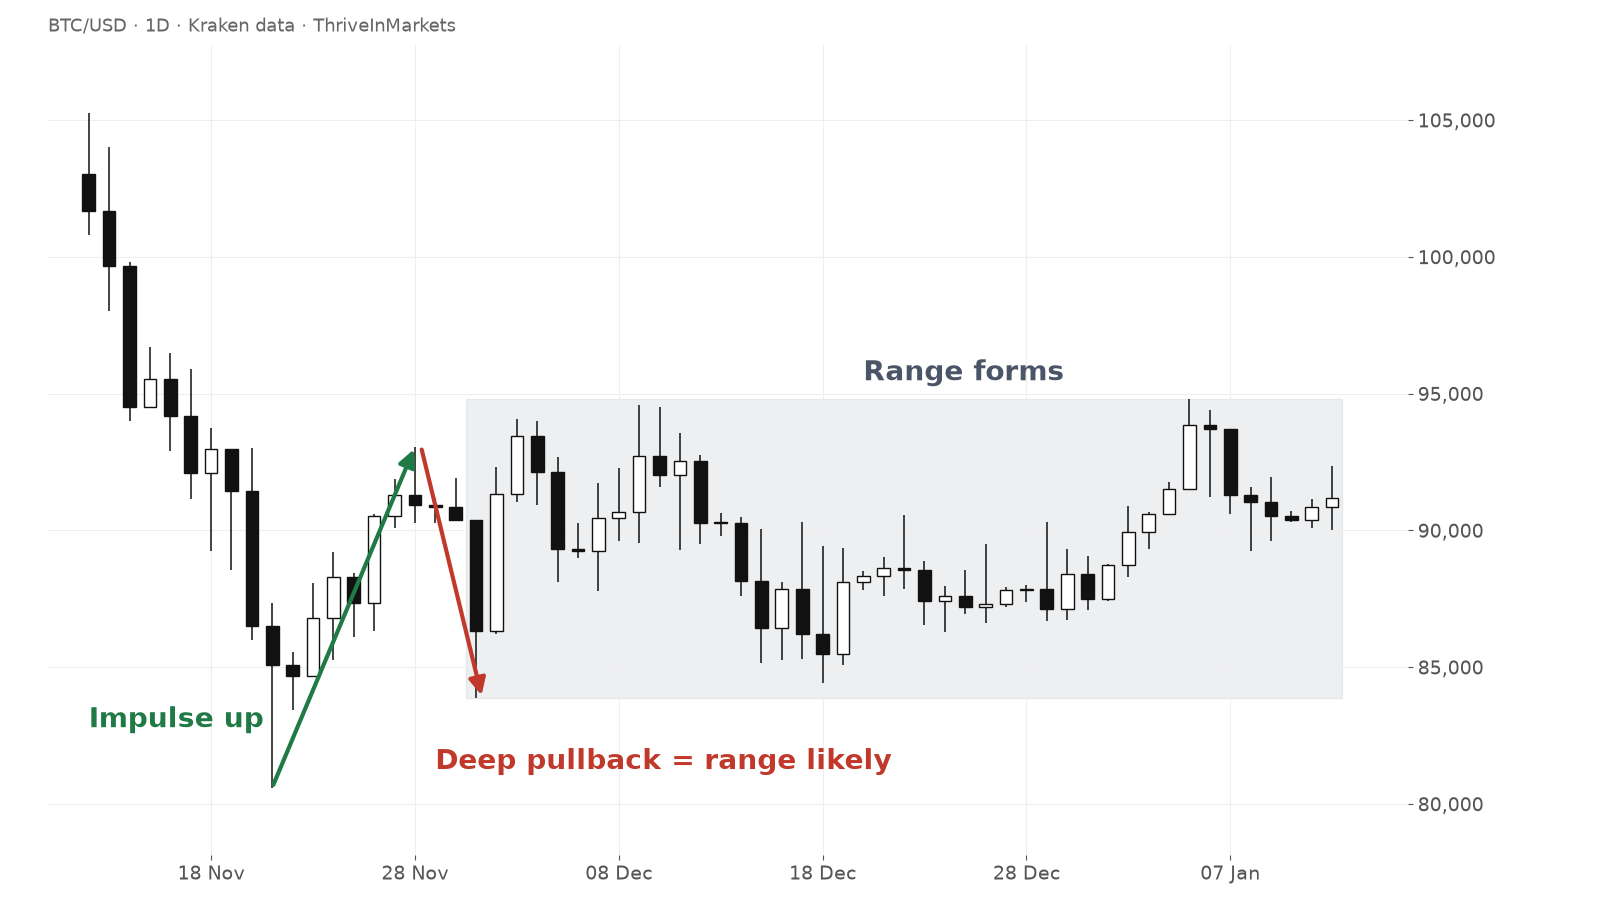
Here's a real example. In late November 2025, Bitcoin bounced from about 80,600 to about 93,000 in a week. Then, in just a few days, it fell back to about 83,900. The wick gave back roughly three-quarters of the move. That's deep enough to stop treating it as a trend; a break in structure is what confirms the range. Price didn't trend after that. It chopped sideways between the mid-80s and the mid-90s for about six weeks.
That deep pullback doesn't guarantee a range, but it tells you to stop treating the market like a trend and start watching for edges.
Trade the edges, skip the middle
Once a range is clear, mark two lines:
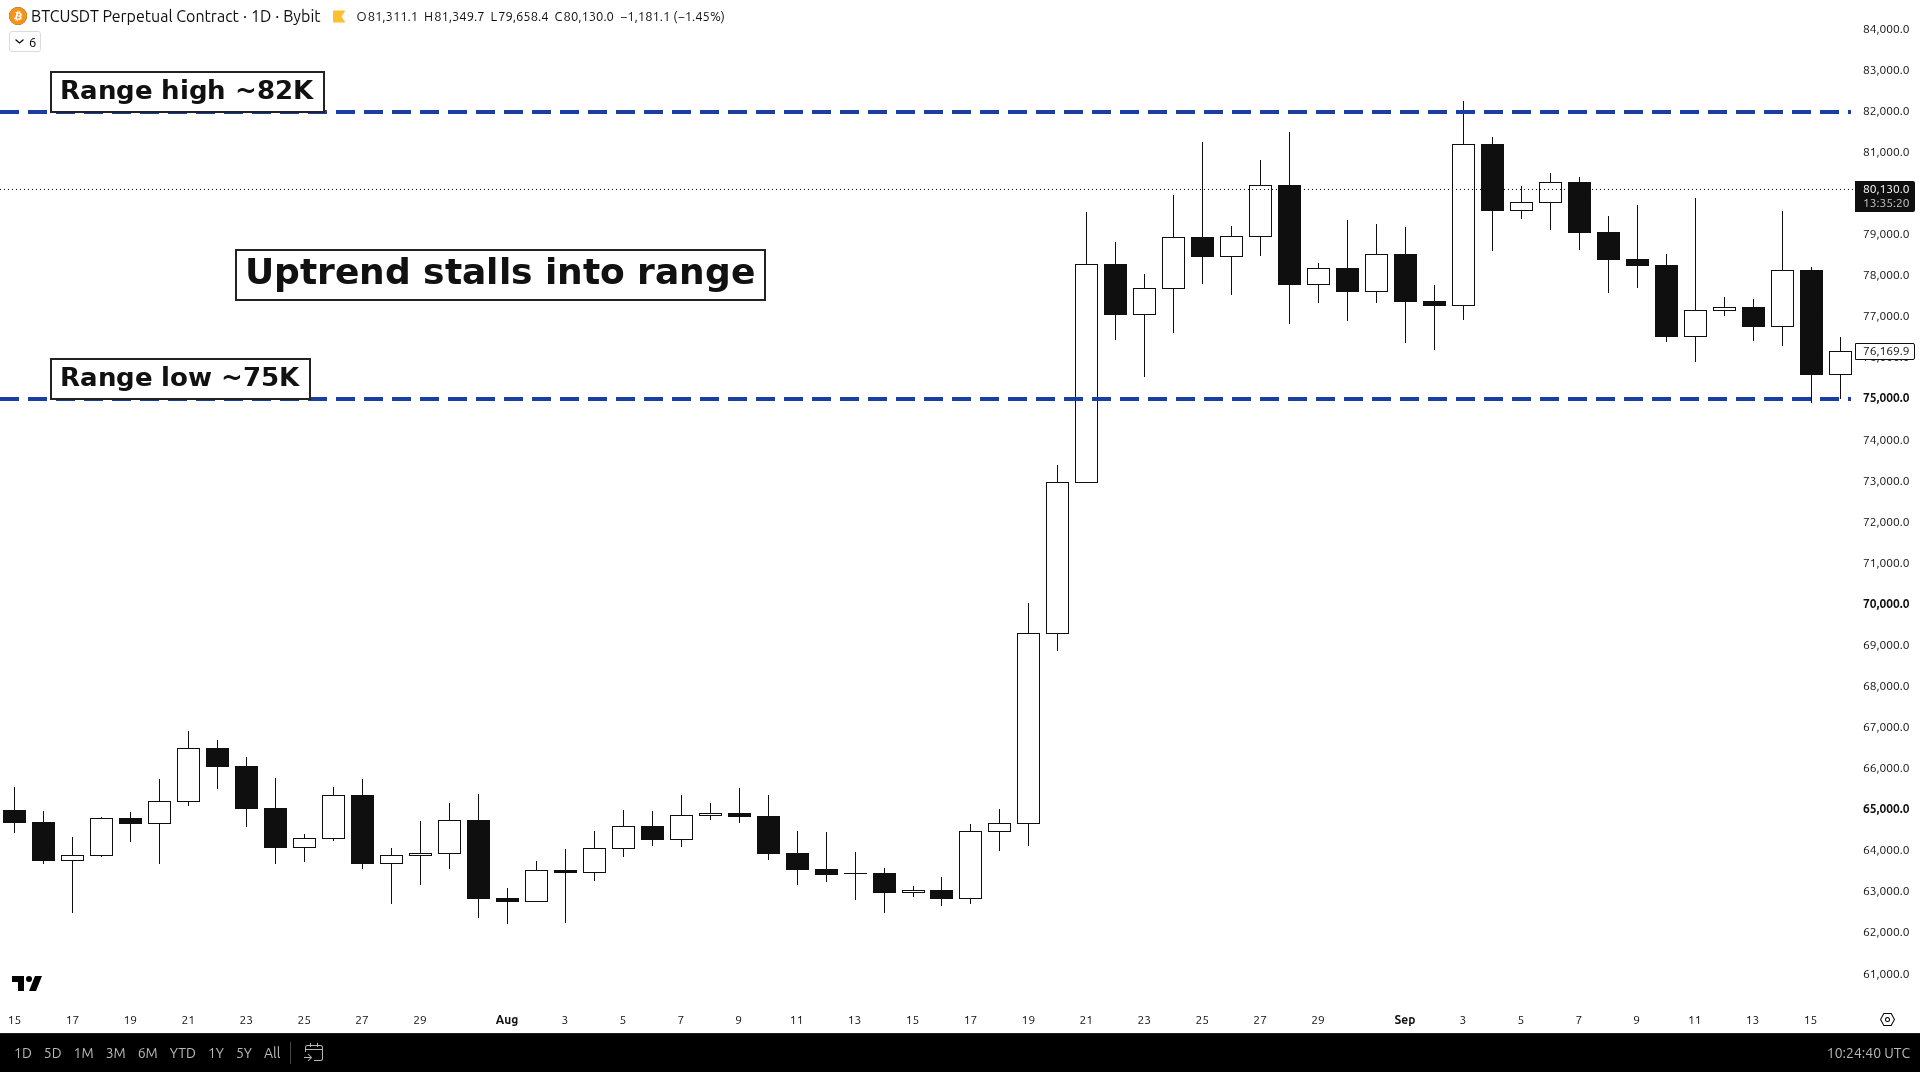
- Range high: the top of the box, where price has been turning down.
- Range low: the bottom of the box, where price has been turning up.
Then split the box into quarters. The bottom quarter is the buy zone, the top quarter is the sell zone, and the middle half is the no trade zone.
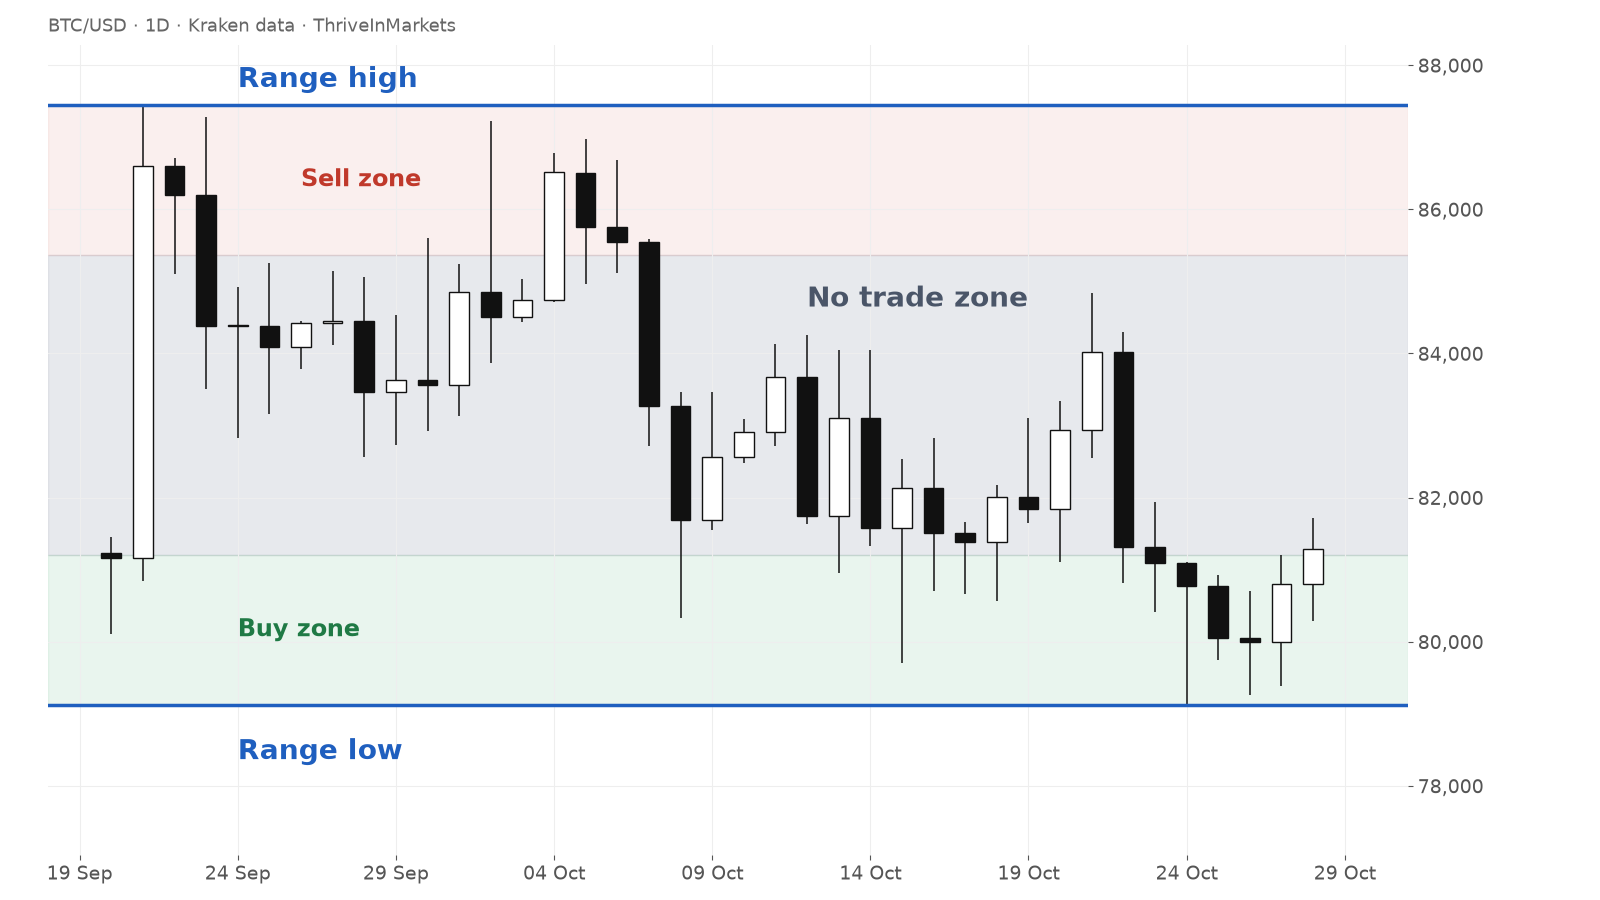
Why skip the middle? Because of where your stop has to go. If you buy near the range low, your stop can sit just beyond the wicks below it, close to your entry. If you buy in the middle, the nearest sensible place for your stop is still beyond the wicks below the range low, which is now far away. Same idea, much bigger risk, and price can just as easily go up or down from the middle.
So the simple plan is:
- Near the range low: look for longs after price sweeps the low and closes back inside, with the stop just beyond that sweep.
- Near the range high: look for shorts or take profit after price sweeps the high and closes back inside, with the stop just beyond that sweep.
- In the middle: do nothing. Waiting is a position too.
In the chart above, from late September to late October 2026, Bitcoin moved between about 79,100 and 87,400, and a lot of the chop happened away from the edges. Then on 29 and 30 October it closed below the range low, the second time more than 20% of the range height below it. That's how a range ends: not a wick, but a close well beyond the edge. A planned stop gets you out with a small loss instead of hoping.
A hypothetical example
Hypothetical numbers, for illustration only. Say a range runs from 100 to 120. Trader A buys at 110, in the middle. Wicks below a range low are normal, and in this range the sweep zone runs down to about 96. So Trader A's stop must also go below 96, which means 14 or more points of risk. Trader B waits for price to sweep the low and close back inside around 101, and buys there with a stop at 95, risking 6 points. Both are betting on the same range. Trader B is just taking far less risk to do it.
Before any range trade, plan 3 paths: price bounces off the edge, price breaks out of the range, or price keeps chopping. Know your exit for each.
Quick recap
- Markets spend long stretches going sideways, not just trending.
- A pullback that gives back about three-quarters or more of a move (on closes) is an early sign a range may be forming; a break in structure confirms it.
- Mark the range high and range low, and treat the middle half as a no trade zone. Buy in the bottom quarter, sell in the top quarter.
- Trade near the edges after a sweep and close back inside, with the stop just beyond the sweep, so your risk stays small.
- When price closes more than about 20% of the range height beyond an edge, the range is over. That's when the trend rules from Day 9 take over.
New to the series? Start with Why Price Action Comes First, or see every lesson on the daily lessons page.
We use TradingView for every chart on this site. If you want the same setup, you can try TradingView here (affiliate link, we may earn a small commission at no extra cost to you).
← Previous: Day 9: Trend Following for Beginners · Next: Day 11 (coming soon)
Not financial advice. This lesson is for education only, and no profits are promised. Always manage your risk.