Your reversal didn't fail. You marked the wrong low.
In Day 13 we said a close below the last higher low is a reversal warning. That's true, but it raises a fair question: which low? Charts are full of little dips. If you treat every one of them as the floor, you'll call a reversal every other day and watch the trend keep going without you. Today is about picking the one level that really counts.
A swing is the whole move
Think of a swing as the full move between two breaks of structure. In an uptrend, price breaks above a high, pulls back, then breaks above the next high. The lowest point of that pullback, the spot the move actually launched from, is the swing low. That's the level buyers defended, and that's the one that matters.
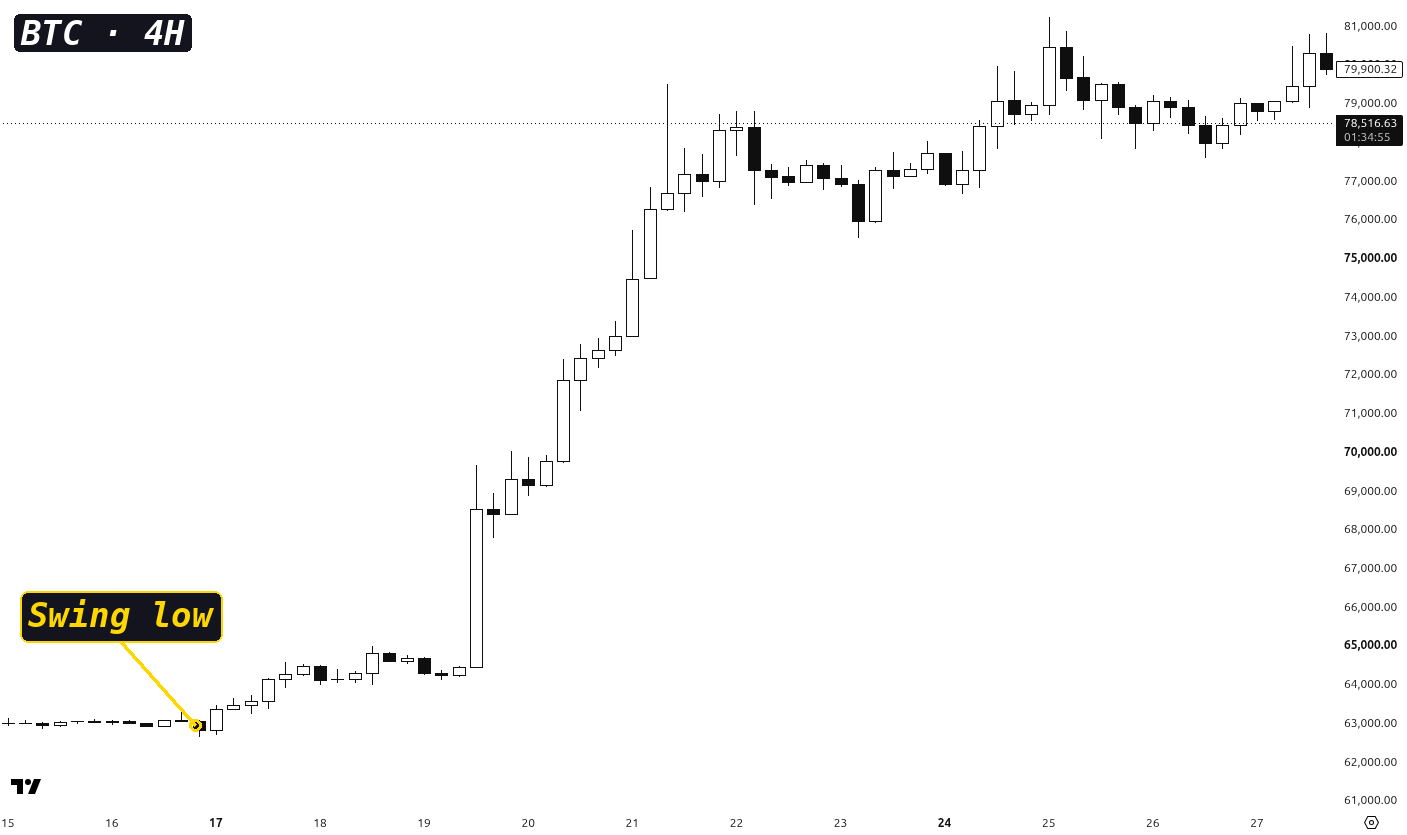
On this 4-hour chart, the swing low is where the whole leg up started. Everything above it is part of the same move.
Minor lows are early warnings, not the floor
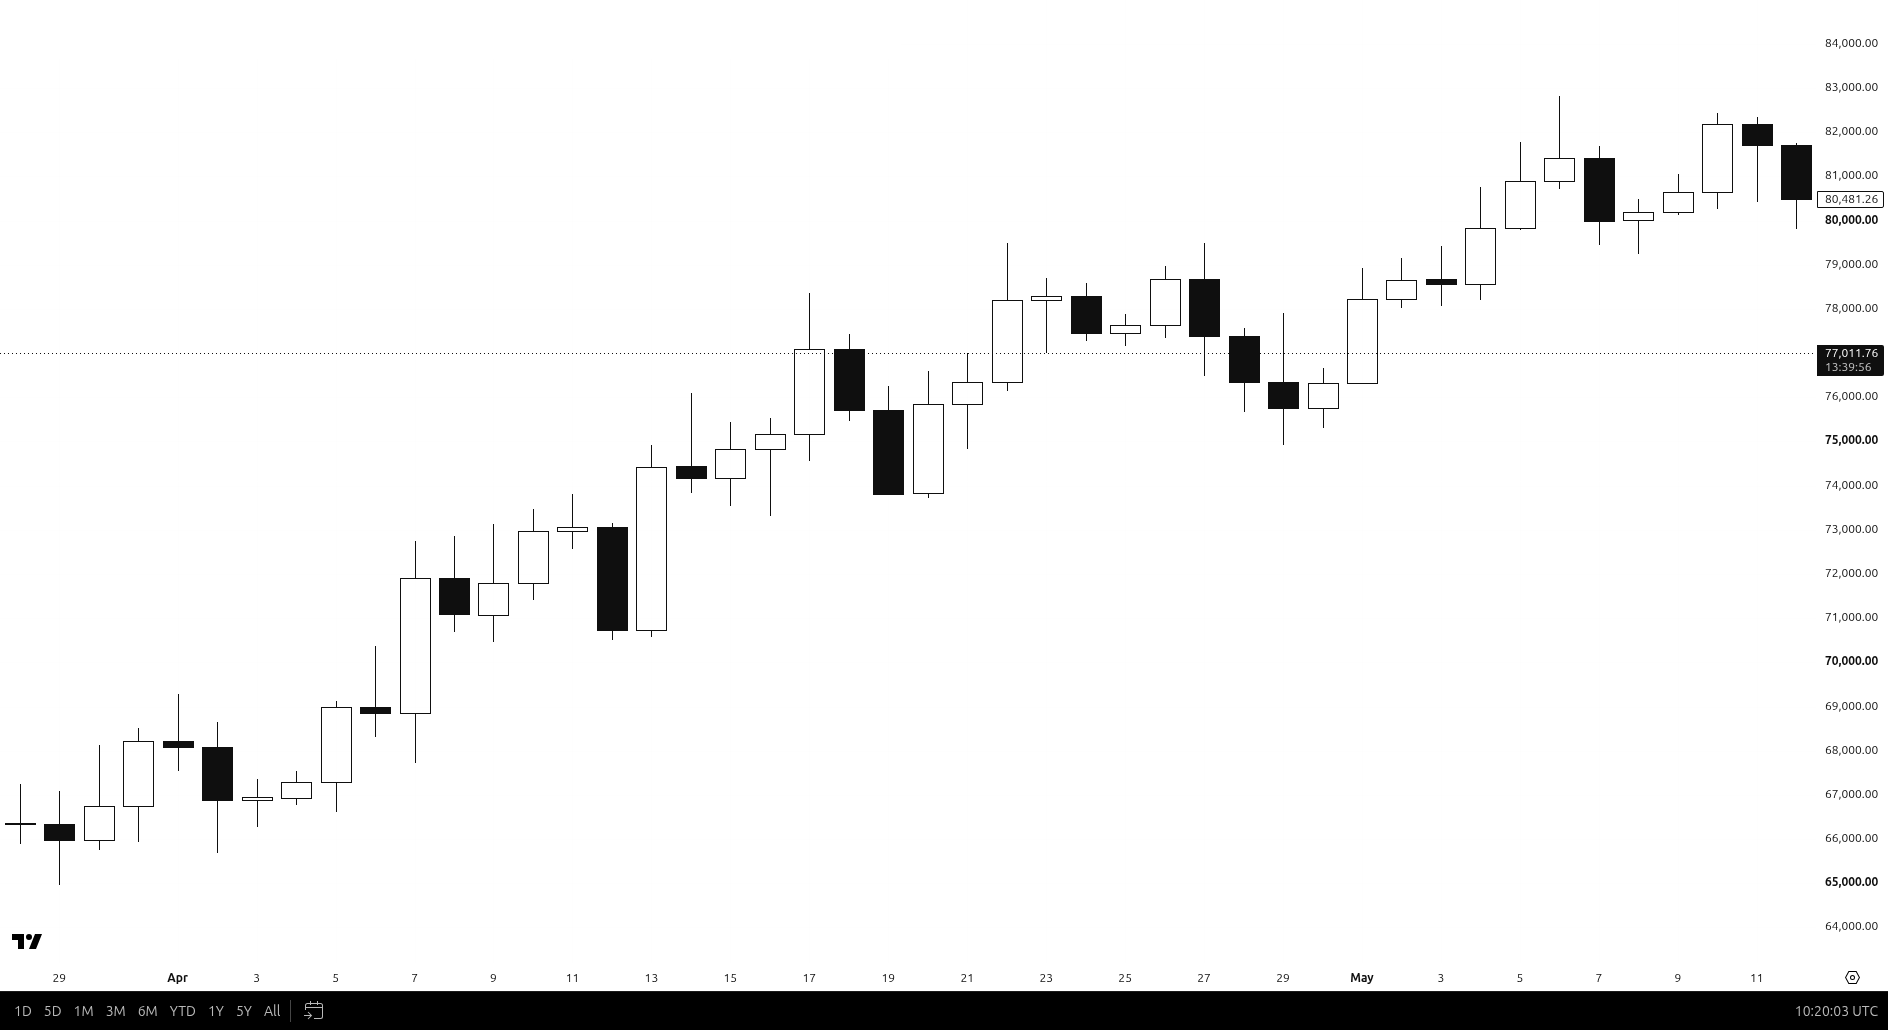
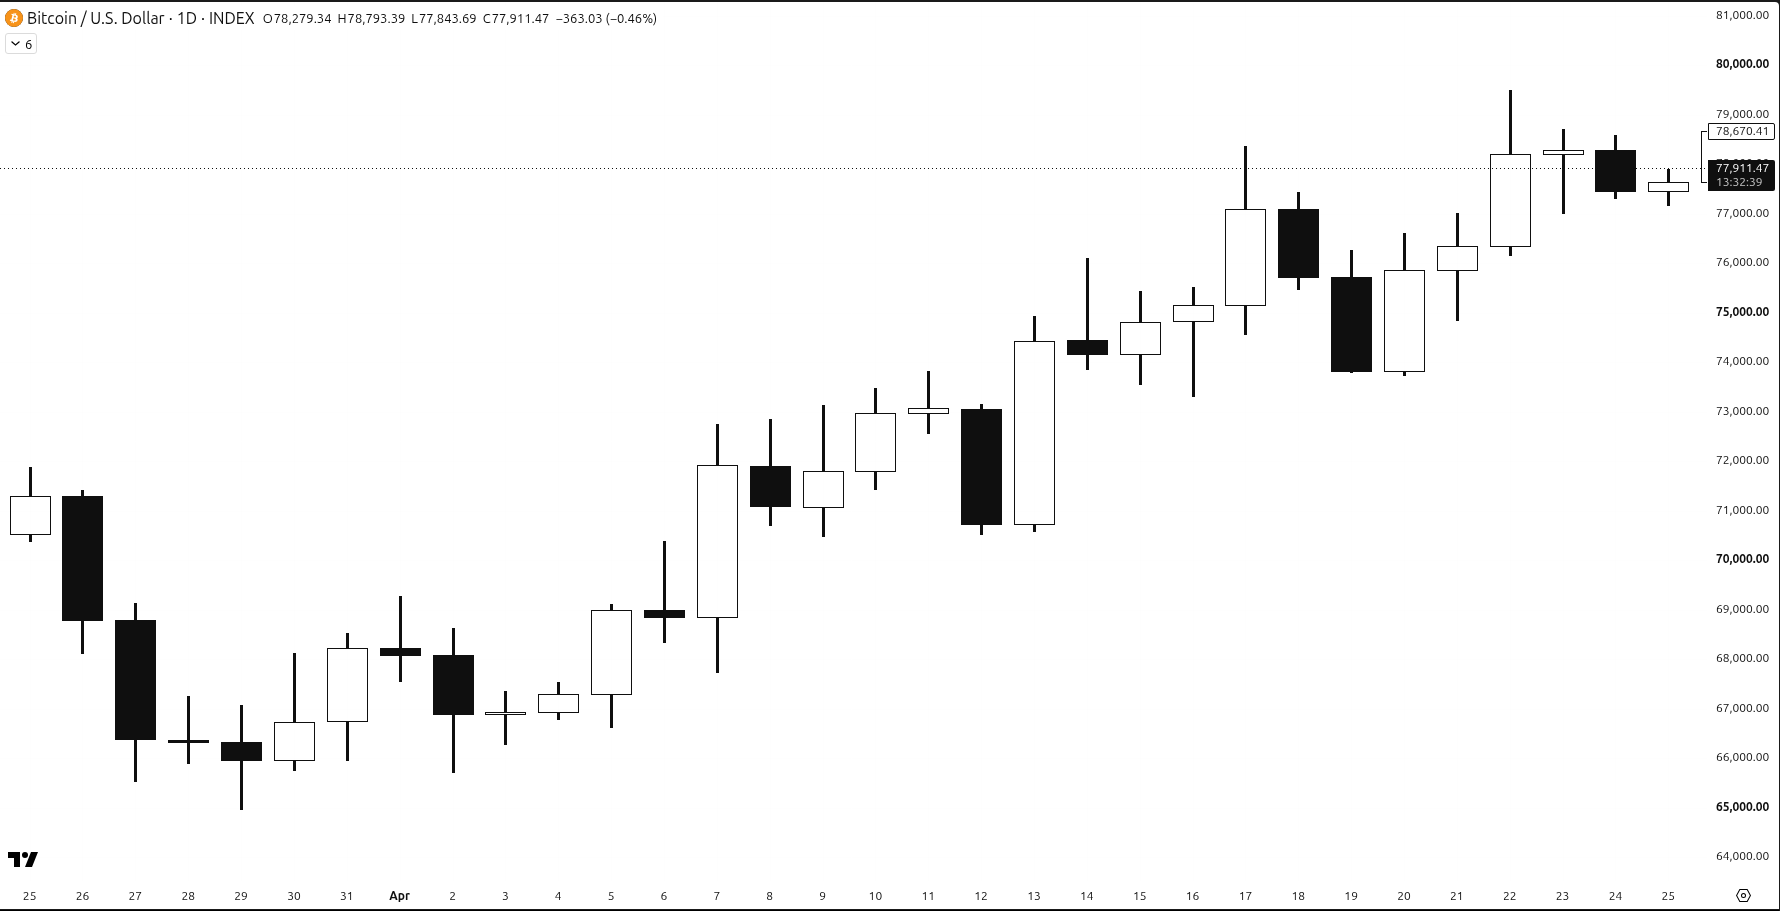
Inside that move you'll see smaller dips. These are minor lows. Price can close under one of them and still carry on higher, because the bigger structure hasn't broken. A close under a minor low is worth noticing. It tells you momentum is slowing. But it isn't a reversal on its own.
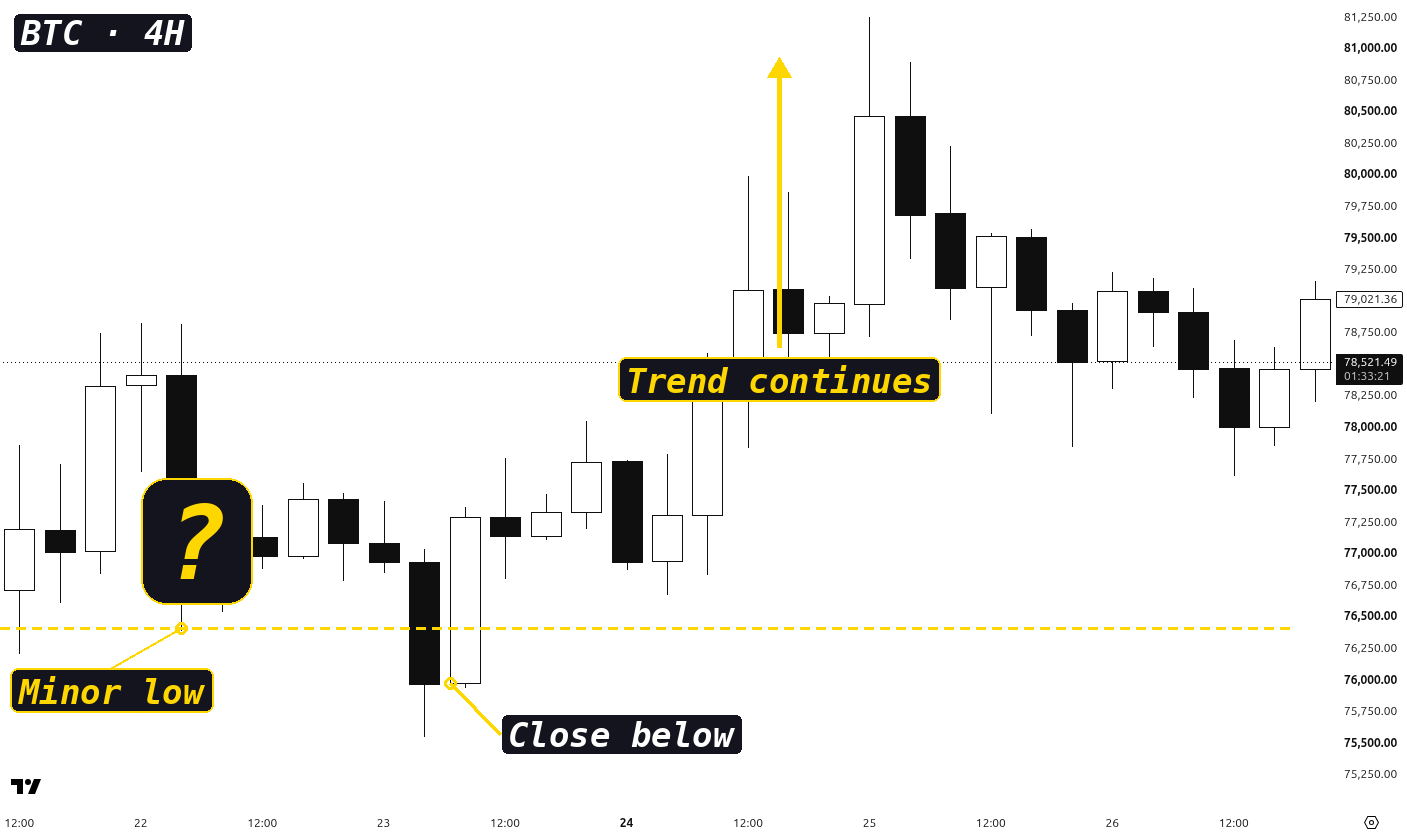
Here price closed below the minor low. Plenty of people would have shouted "reversal" right there. Then the trend picked up again, because the swing low underneath never broke.
- Close below a minor low: early warning, keep watching.
- Close below the swing low: the real structure is broken, reversal warning.
Every reversal starts with a break, but not every break is a reversal
This one is worth saying twice. Every trend change begins with some kind of break. But lots of breaks go nowhere. That's especially true on very low timeframes. On the 1 to 15 minute charts, fake breaks happen all the time: a candle closes beyond a low, traders jump in, and price snaps straight back.
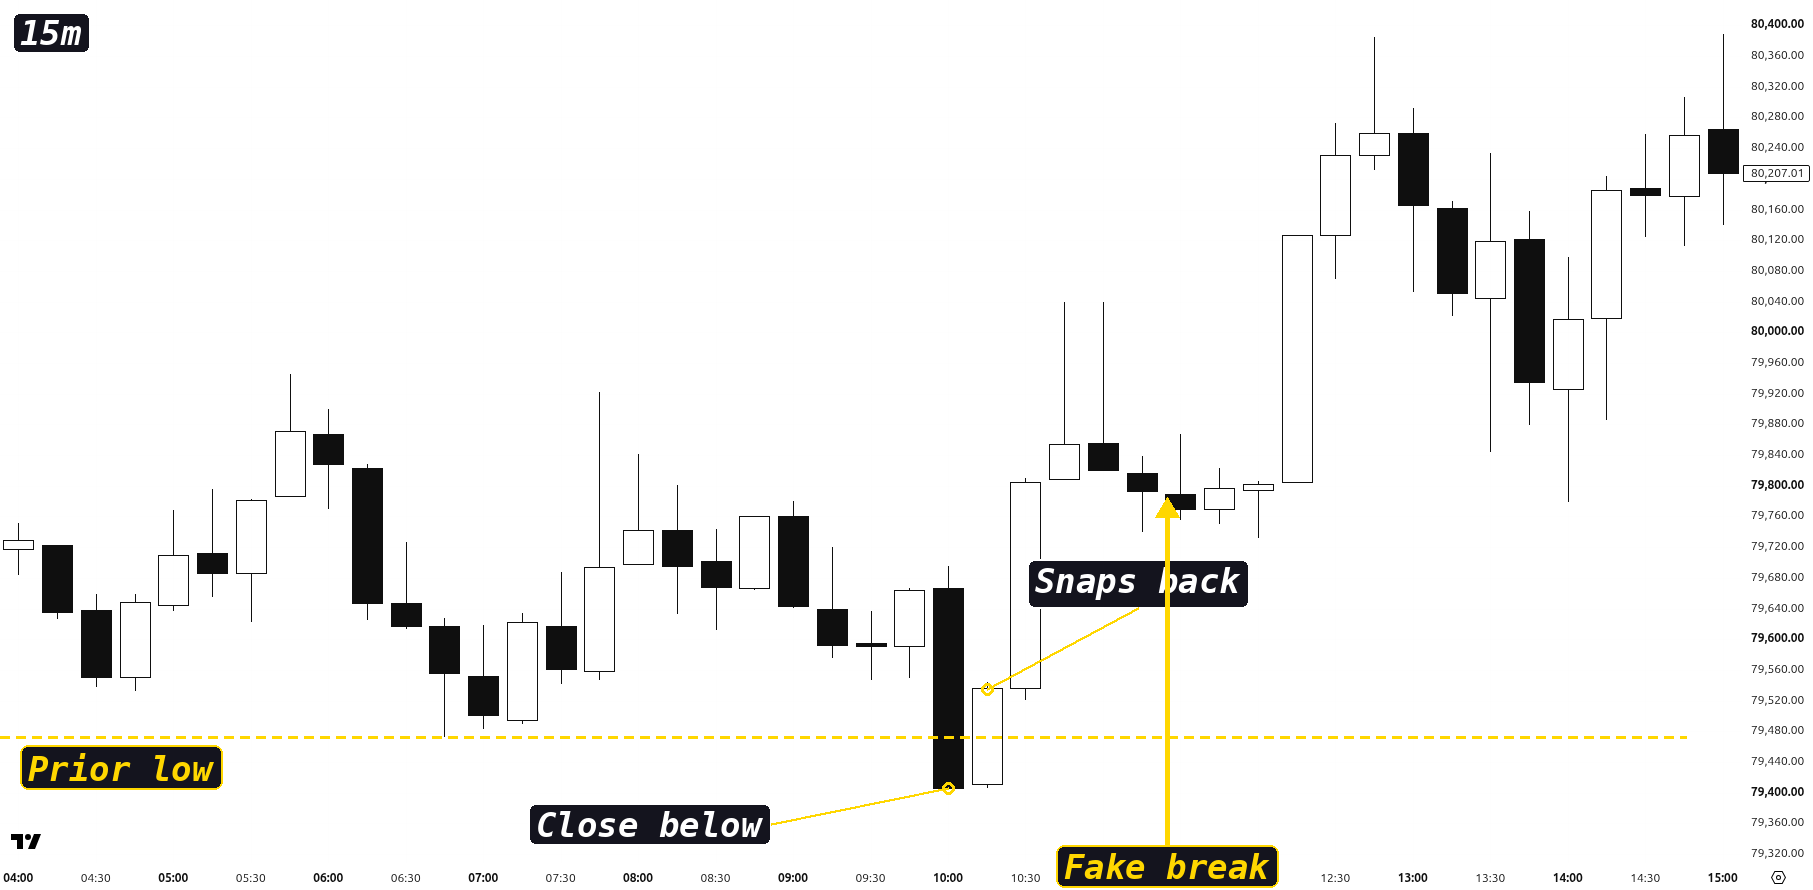
On the 4-hour chart and higher, these fakes happen less often. A close there takes hours of buyers and sellers fighting it out, so it carries more weight. That's why the bigger chart is a better place to find the levels that matter.
How I use it
Before calling a reversal, I ask three things:
- Where did this whole move start? That's my swing low.
- Did price close under the swing low, or only under a minor low?
- What timeframe is this on? A break on 5 minutes means a lot less than one on 4 hours.
If it's only a minor low, I treat it as a heads-up, not a signal. And like always, plan 3 paths before you act: the trend carries on, the swing low breaks, or price chops sideways in a range like we covered in Day 8.
Quick recap
- A swing is the whole move between two breaks of structure.
- The swing low is the level that really counts.
- Minor lows inside the swing are early warnings, not reversals.
- Fake breaks are common on 1 to 15 minute charts and less common on 4 hours and up.
- Find the real swing low before you call a reversal.
New to the series? Start with Why Price Action Comes First, catch up on Market Structure Explained Simply, or see every lesson on the daily lessons page.
We use TradingView for every chart on this site. If you want the same setup, you can try TradingView here (affiliate link, we may earn a small commission at no extra cost to you).
← Previous: Day 13: Breaks of Structure: Continuation vs Reversal · Next: Day 15 (coming soon)
Not financial advice. This lesson is for education only, and no profits are promised. Always manage your risk.