Impulse doesn't mean pump. Some of the strongest impulses go straight down.
Price never moves in a straight line. It moves in waves: a fast move, a slow pause, then another fast move. The fast move is called an impulse. The slow pause is called a correction. Once you can tell the two apart, a messy chart gets a lot easier to read, because the fast leg tells you which way the trend is going.
Zoom out: fast legs and slow legs
Look at Bitcoin on the daily chart from October 2025 to March 2026. We shaded the fast legs down in red and the slow legs up in grey.
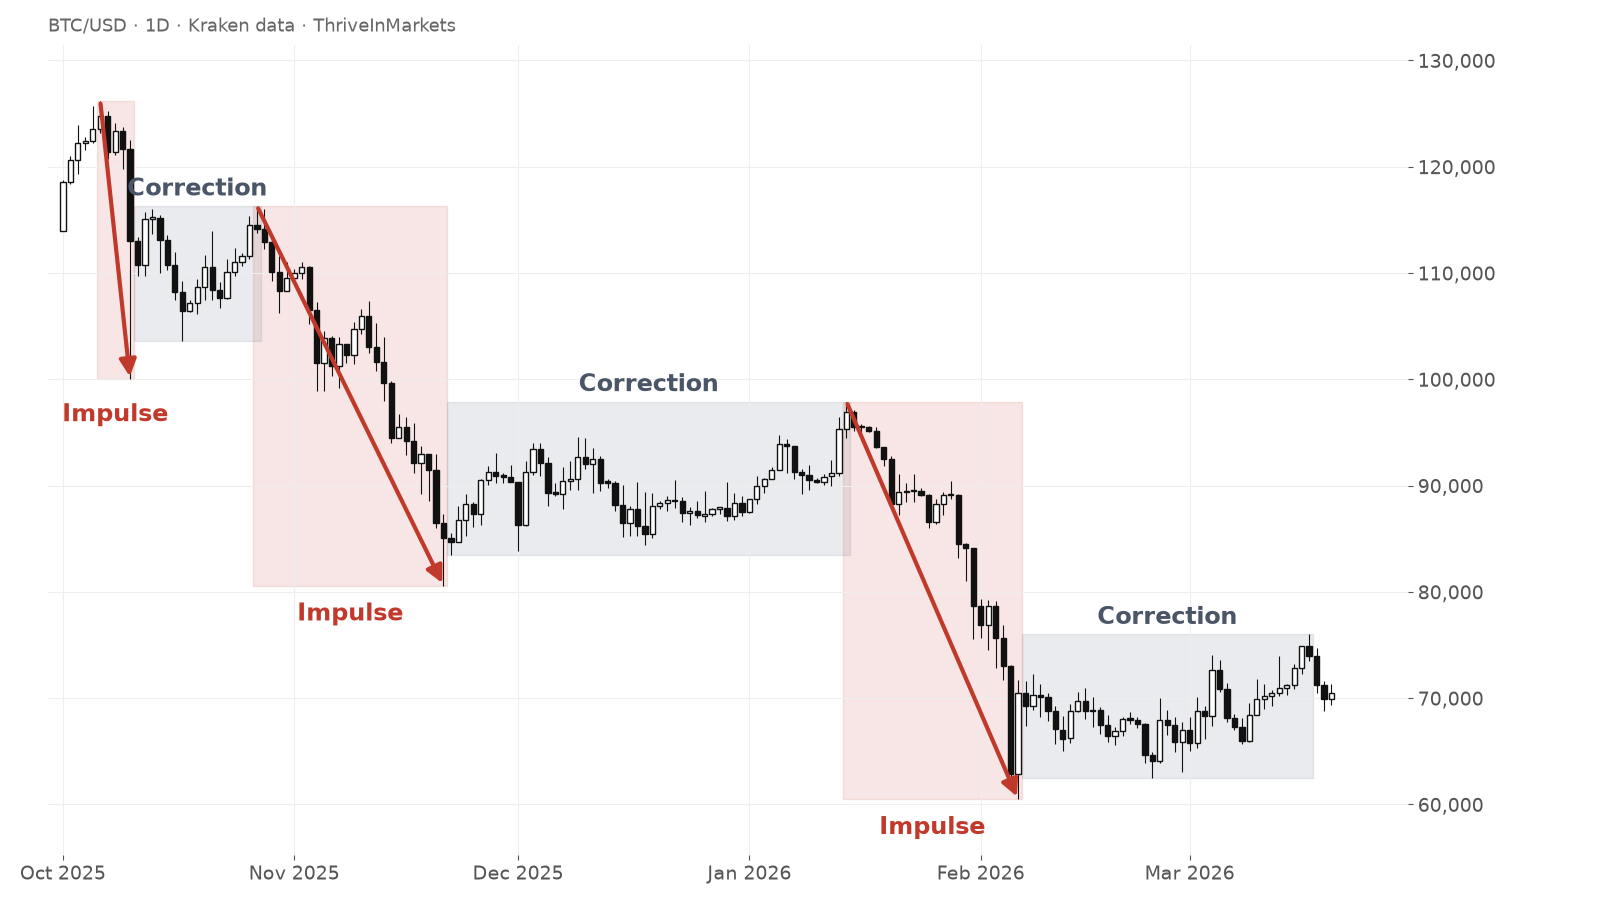
See the rhythm? The drops were quick (the October drop hit 100,000 only for a moment, on a single wick). From 27 October to 21 November 2025, Bitcoin fell from about 116,300 to about 80,600 in under four weeks. Then it spent almost two months, from late November to mid-January, slowly climbing back to about 97,900. Then another fast drop, to about 60,500 by 6 February. Then another slow climb.
The bounces were real moves up, sometimes more than 15,000 dollars. But each one topped out lower than the one before (about 116,300, then 97,900, then 76,000). They were pauses inside a downtrend, not a new uptrend.
How to tell them apart
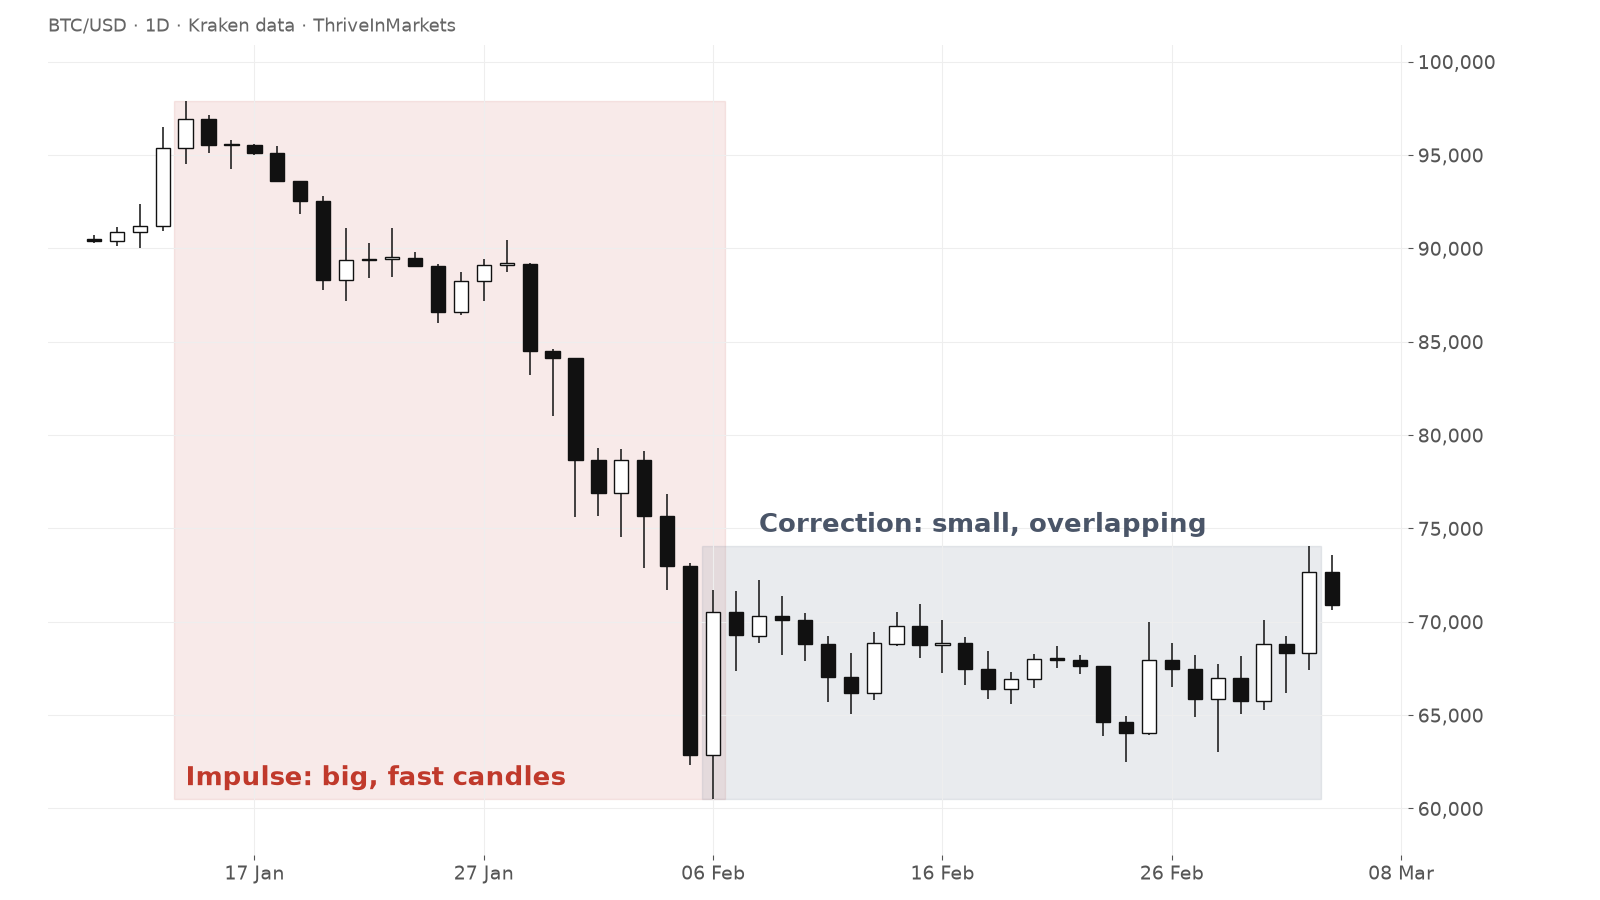
Put one impulse right next to one correction and the difference jumps out:
- Impulse: big candles, mostly the same colour, little overlap. Price covers a lot of distance in a short time. From 14 January to 6 February 2026 the average daily candle body was about 2,270 dollars, and on 5 February alone Bitcoin opened near 73,000 and closed near 62,900.
- Correction: small candles, mixed colours, lots of overlap. Price goes up, down, sideways, and takes longer to get anywhere. From 7 February to 4 March the average body was about 1,360 dollars, and price chopped mostly between the mid-60s and low 70s.
A simple test: if you'd describe the move as "fast and clean", it's probably the impulse. If you'd describe it as "slow and messy", it's probably the correction.
The fast leg tells you the trend
Here's the key idea, and the reason for the title: impulse doesn't mean up. An impulse is just the fast, strong leg, and it can point down just as easily. The direction of the impulses is the direction of the trend.
On the first chart, every impulse pointed down, so the trend was down, and every bounce was a correction. A beginner who saw a two-month climb from 80,600 to 97,900 and thought "new uptrend" was reading the slow leg as if it were the fast one. In Day 9 we followed trends once they break out. Spotting the impulse is how you know which way that trend is going in the first place.
This doesn't mean a downtrend lasts forever. Trends change, and in the four phases lesson we saw how. A good clue is when the impulses start pointing the other way, for example when a move up is suddenly the fast, clean leg and the drops become slow and choppy. It's confirmed once price also breaks the last lower high.
Waves inside waves
Zoom in on any wave and you'll find smaller waves inside it. Here is the start of the February 2026 correction on the 4-hour chart.
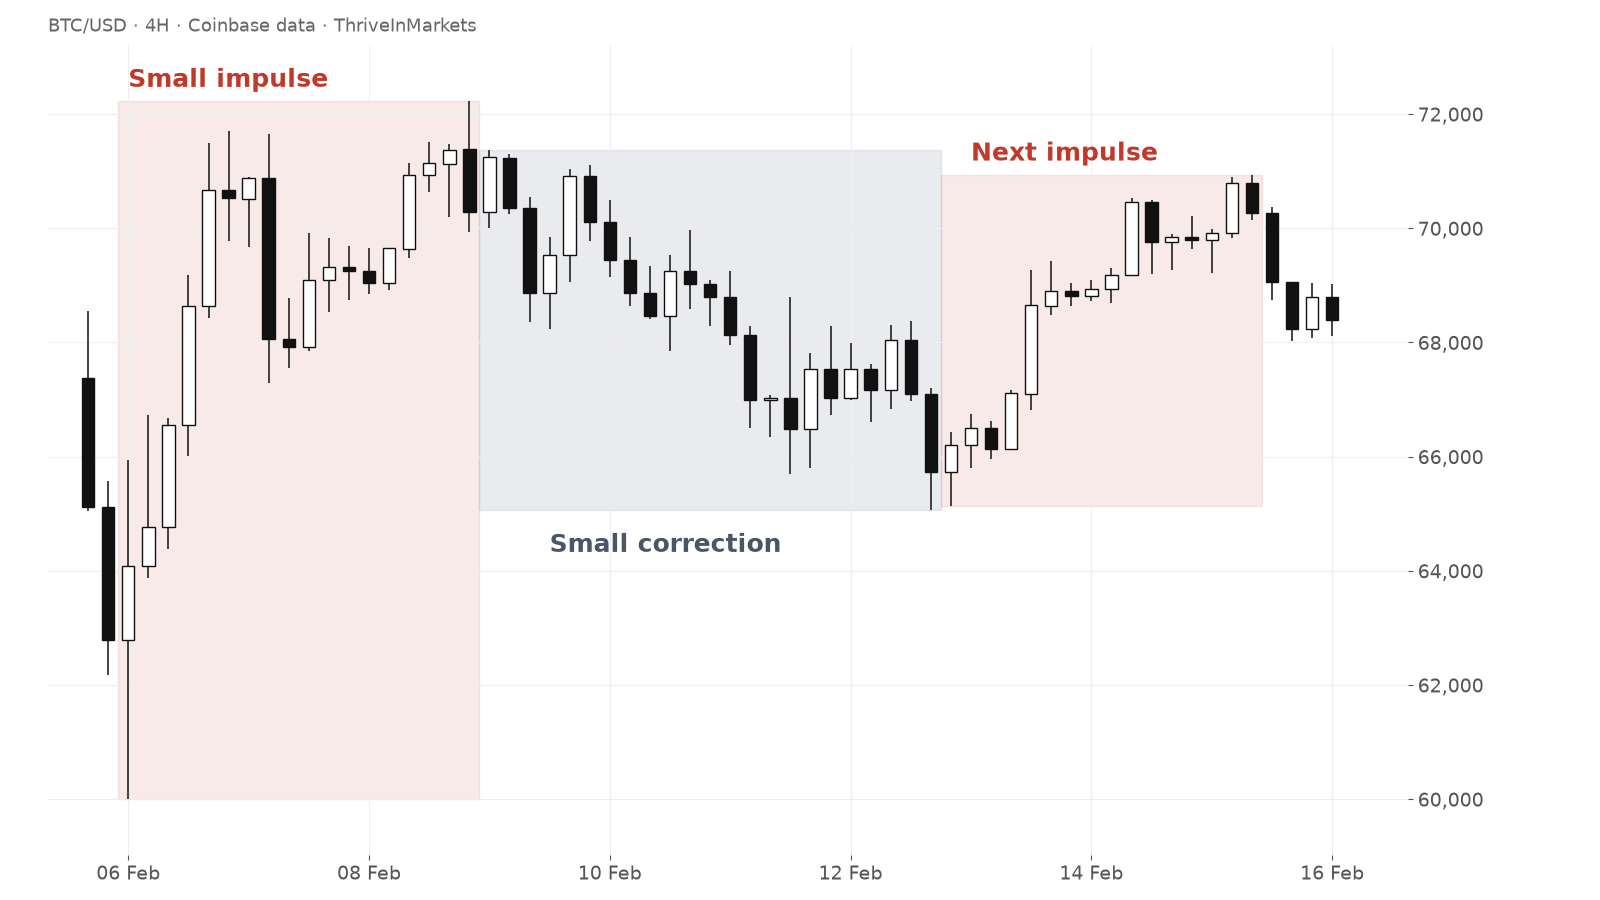
On the daily chart, this whole stretch is one slow correction up. On the 4-hour chart, it has its own fast push up (from about 60,000 to about 72,200 in under three days), its own slow pullback (to about 65,100 by 12 February), and then another, choppier push up. Smaller timeframes are messier, so waves there are less clean. Each timeframe has its own path.
That's why it pays to know which timeframe you're trading. A clean 4-hour impulse up can still be just part of a daily correction inside a bigger downtrend. Start from the higher timeframe, then zoom in.
Where the stop goes
Waves also tell you where a trade idea is proven wrong. Hypothetical numbers, for illustration only. Say price is in a downtrend and a correction climbs from 100 to 110, then starts falling fast again. If you short as the new impulse starts, your stop goes just beyond the top of that correction, above the wicks around 110. If price climbs back above that high, the correction wasn't finished and the idea is wrong. The stop sits where the structure says you're wrong, not at a fixed distance or percentage from your entry.
Then size the trade so that, if the stop is hit, you only lose a small part of your account. And before you enter, plan 3 paths: the correction ends and the trend continues, the correction keeps going, or the trend turns.
Quick recap
- Price moves in waves: fast impulses and slow corrections.
- Impulses have big candles with little overlap. Corrections have small, overlapping, mixed candles.
- Impulse doesn't mean up. The direction of the fast leg is the direction of the trend.
- Every wave contains smaller waves. Start from the higher timeframe so you know which leg you're in.
- Put your stop beyond the structure that proves you wrong, like the end of the last correction, never at a fixed percentage, and keep the risk to a small part of your account.
New to the series? Start with Why Price Action Comes First, or see every lesson on the daily lessons page.
We use TradingView for every chart on this site. If you want the same setup, you can try TradingView here (affiliate link, we may earn a small commission at no extra cost to you).
← Previous: Day 10: Why Range Trading Is Underrated · Next: Day 12 (coming soon)
Not financial advice. This lesson is for education only, and no profits are promised. Always manage your risk.