That breakout you just bought? Check where the candle closed.
In Day 12 we read structure from highs and lows: higher highs and higher lows mean up. Today is about the moment that structure gets tested. When price pokes past a key level, is it a real break of structure or just a fake-out? The simplest filter I use: look at the close, not the wick.
The wick is a test, the close is the answer
A wick shows where price went during the candle. The close shows where buyers and sellers agreed to leave it when time ran out. Price can spike above a high for a few hours, catch everyone who buys the breakout, then fall back. If the candle closes back below the high, the market tested the level and rejected it.
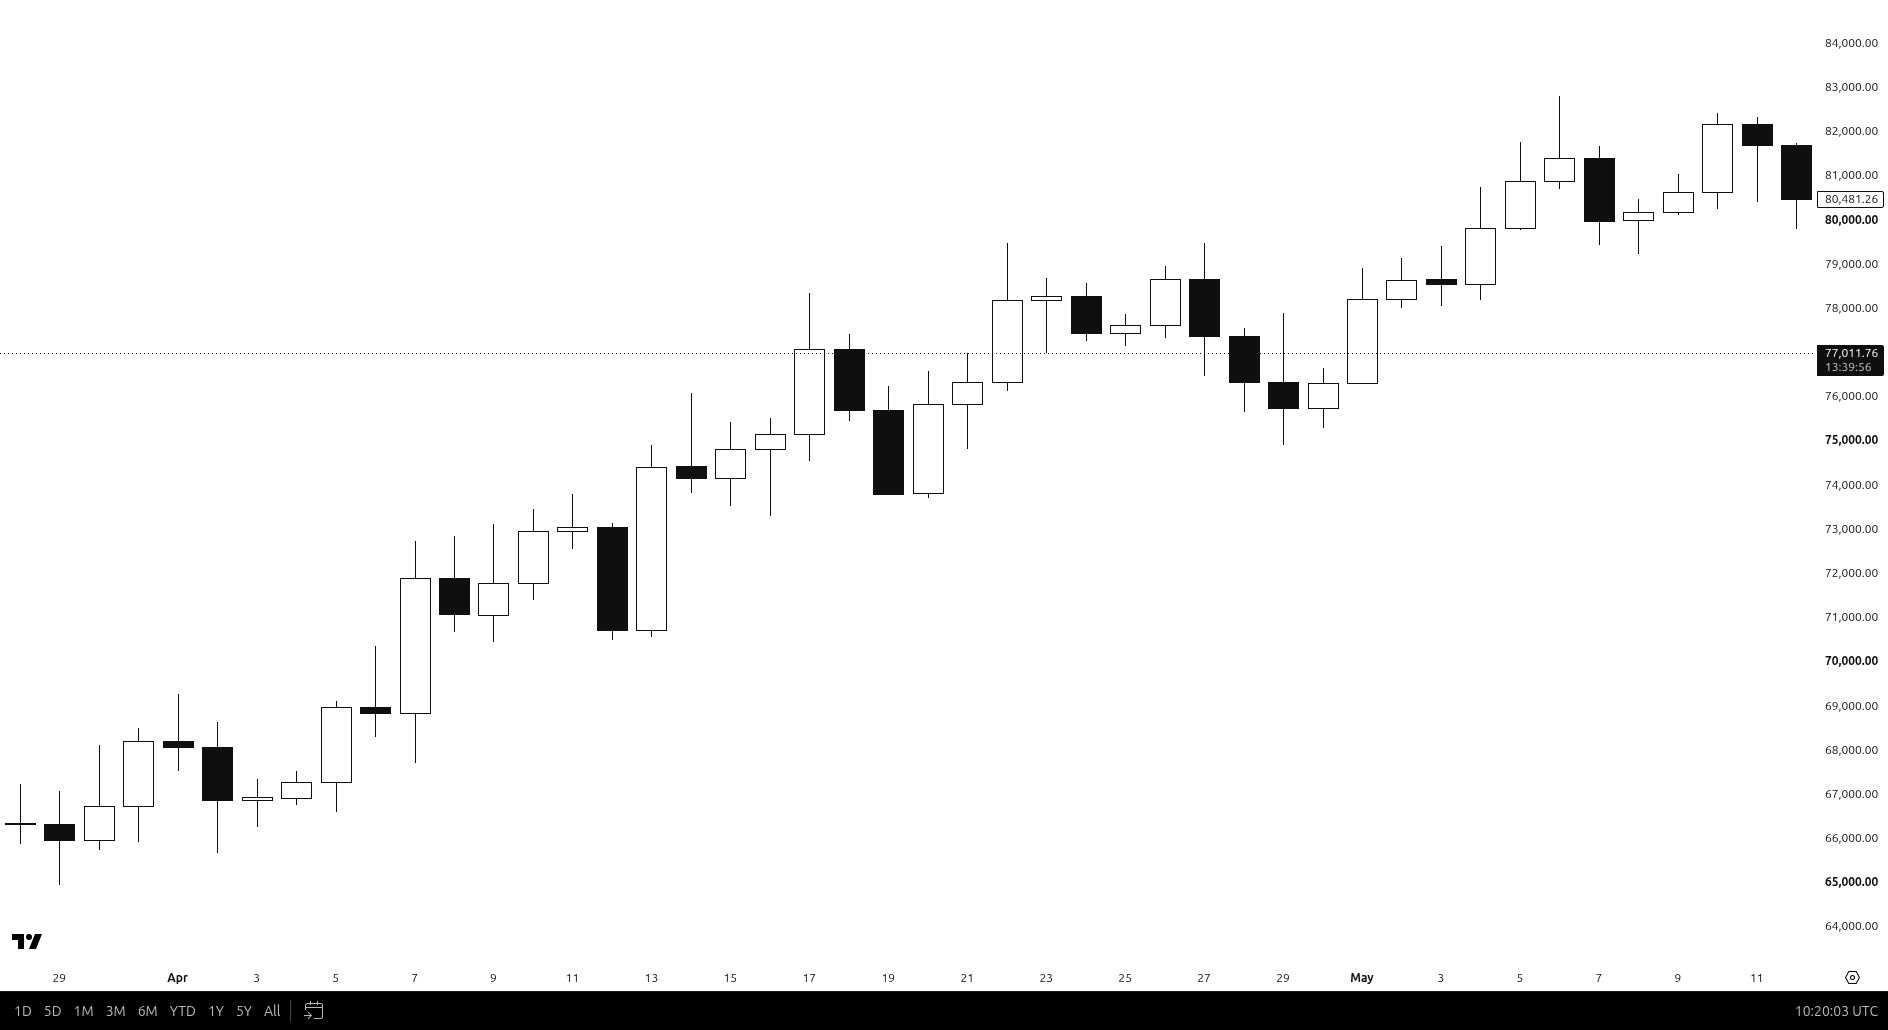
On this daily BTC chart the wick goes above the last high, but the close is back under it. On a daily chart, that's not a break yet. It's a warning that buyers couldn't hold it.
Close above the last high = continuation
In an uptrend, the break that matters is a candle that closes above the last high. That's a new higher high on a closing basis, and it says the trend is likely to carry on.
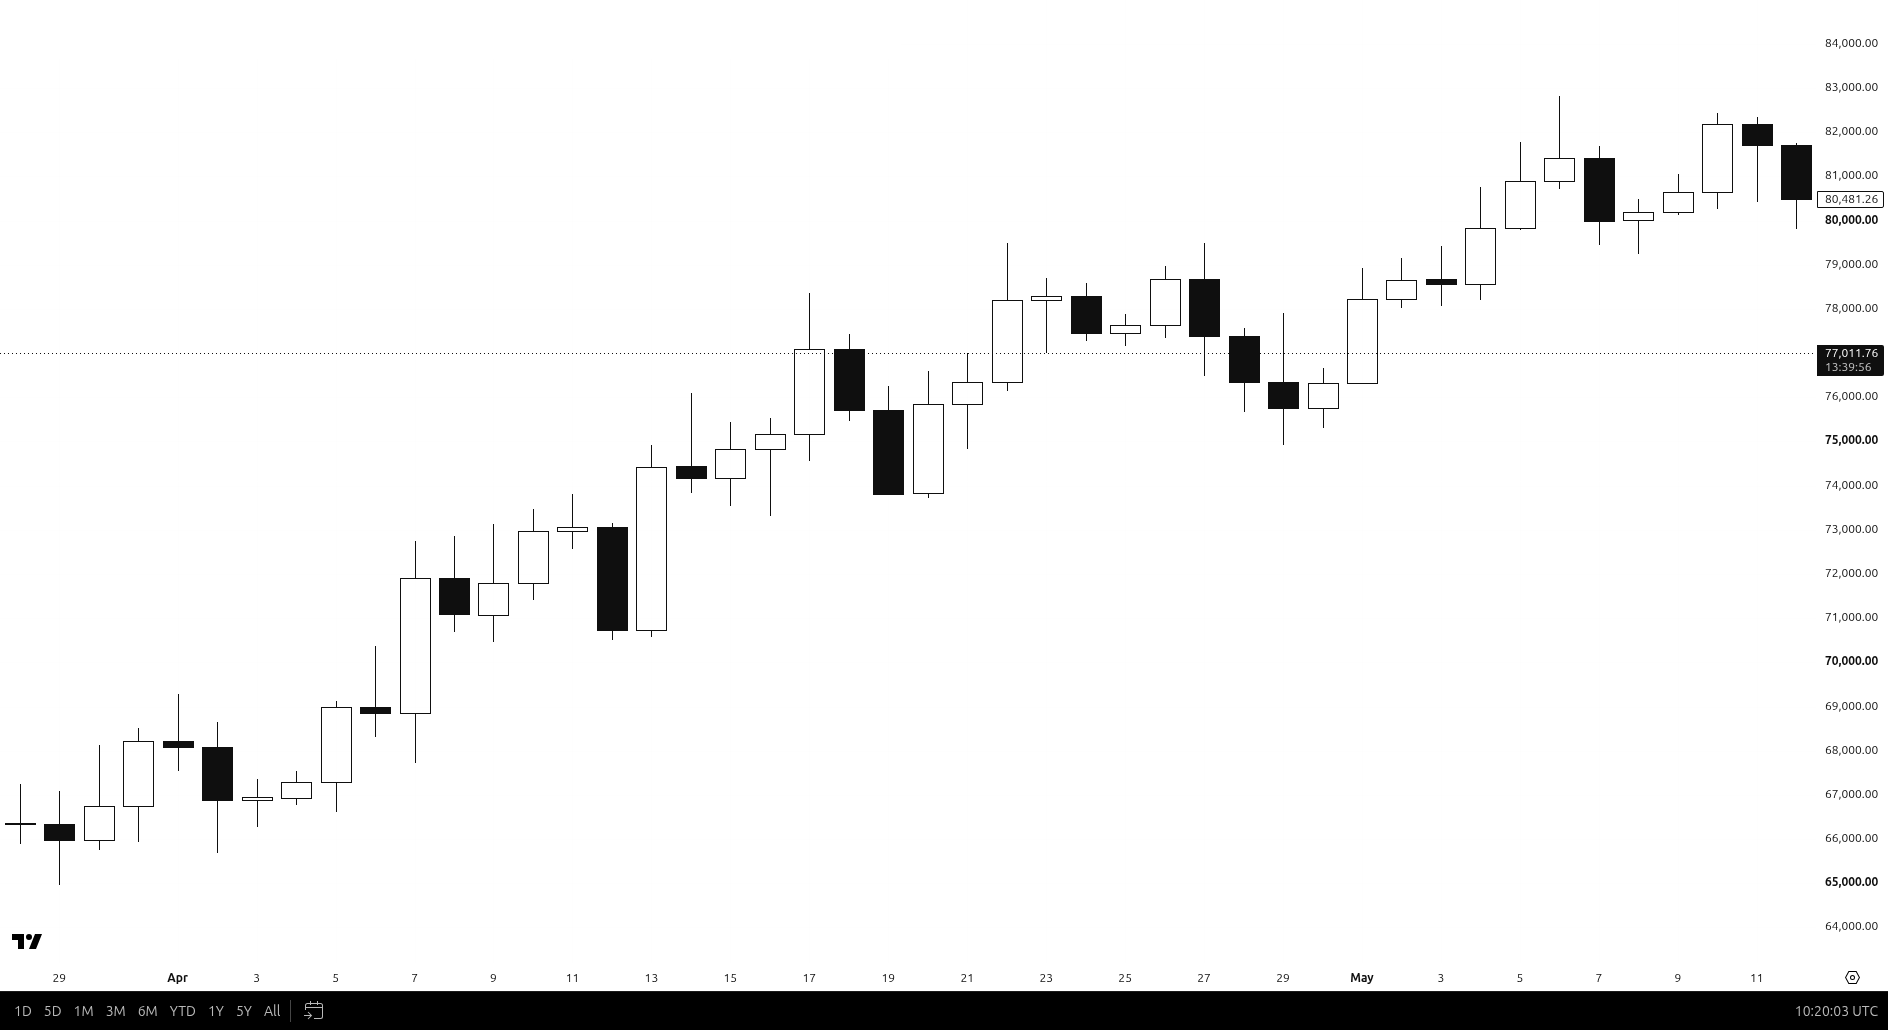
A few days after the fake wick, price came back and this time closed above the high. Same level, different story. The close is what turned a test into a break.
Close below the last higher low = reversal warning
The other side matters just as much. In an uptrend, the higher lows are the floor. When a candle closes below the last higher low, the up structure is broken. It doesn't mean the market must crash, but it's a clear warning that the trend may be turning, or at least pausing in a range like we covered in Day 8.
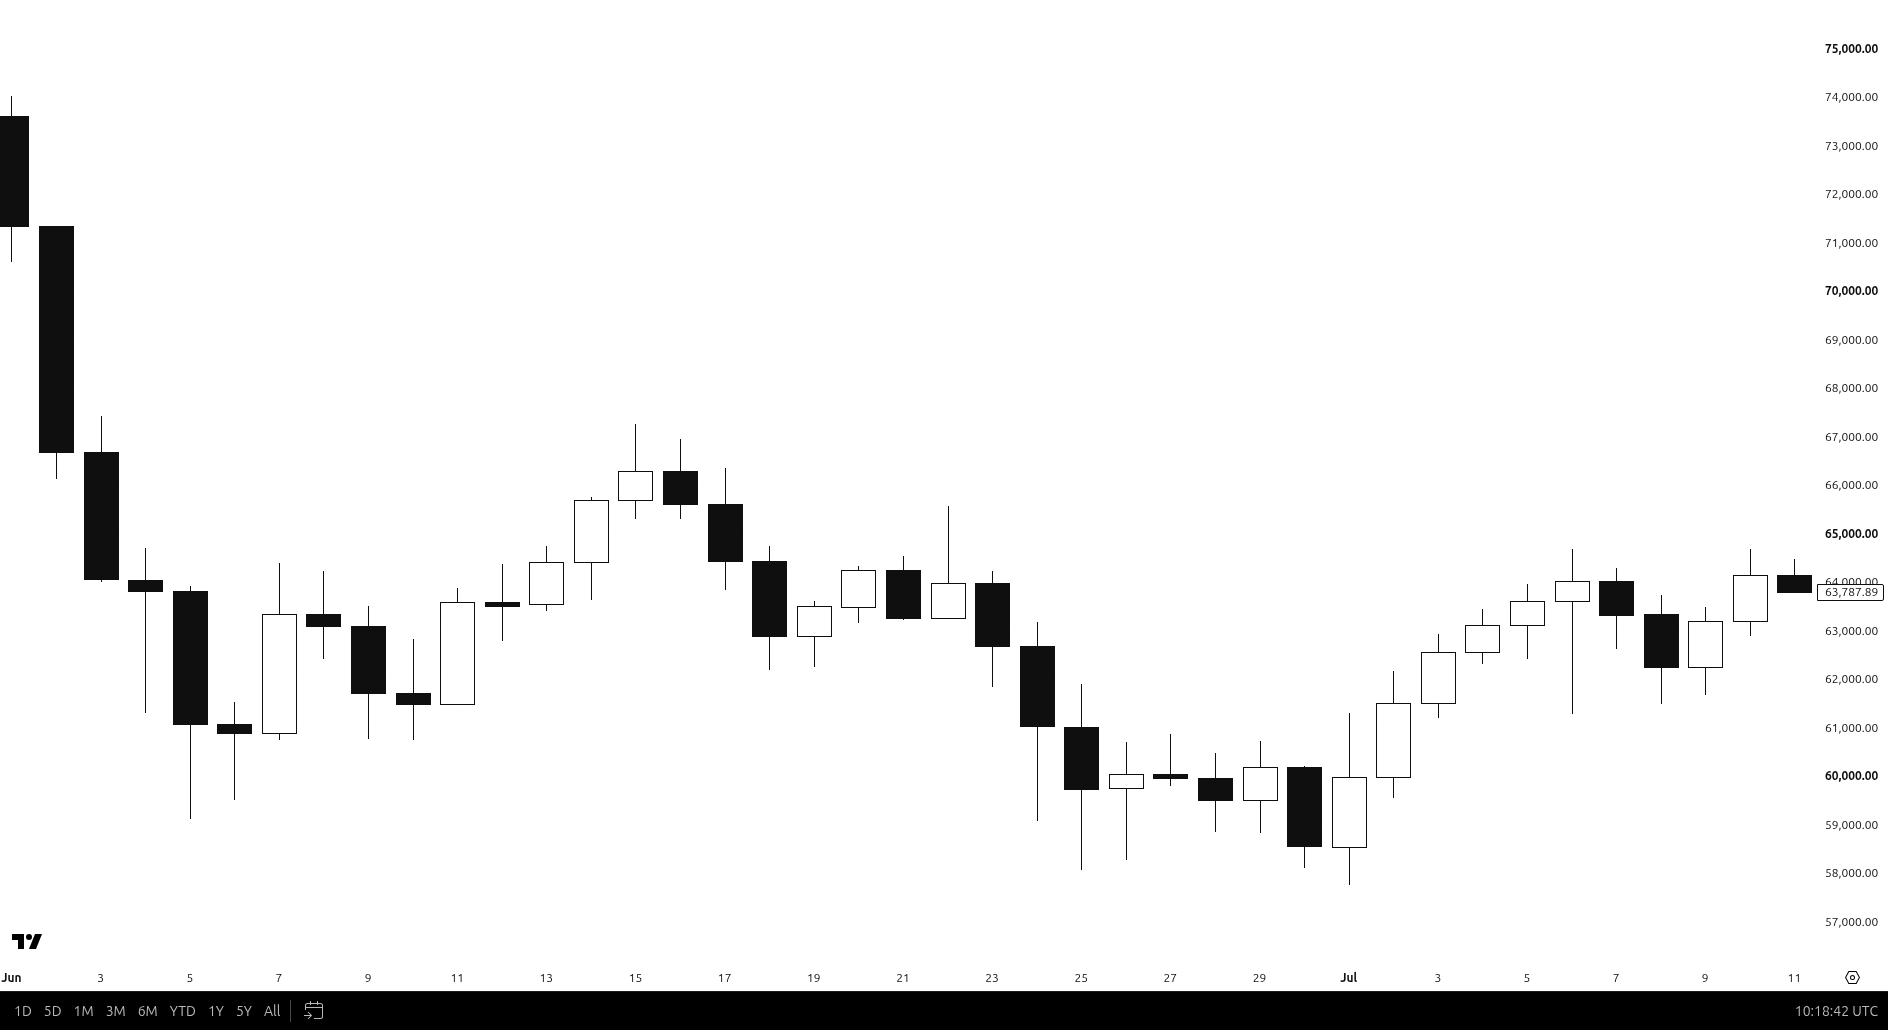
- Close above the last high: continuation, the trend is still in charge.
- Close below the last higher low: reversal warning, the up structure is broken.
- Wick through, close back inside: no break yet, often a trap.
Line charts hide the wicks
A quick trick if wicks keep confusing you: switch to a line chart. A line chart only joins the closes, so the spikes disappear and you only see where each candle finished.
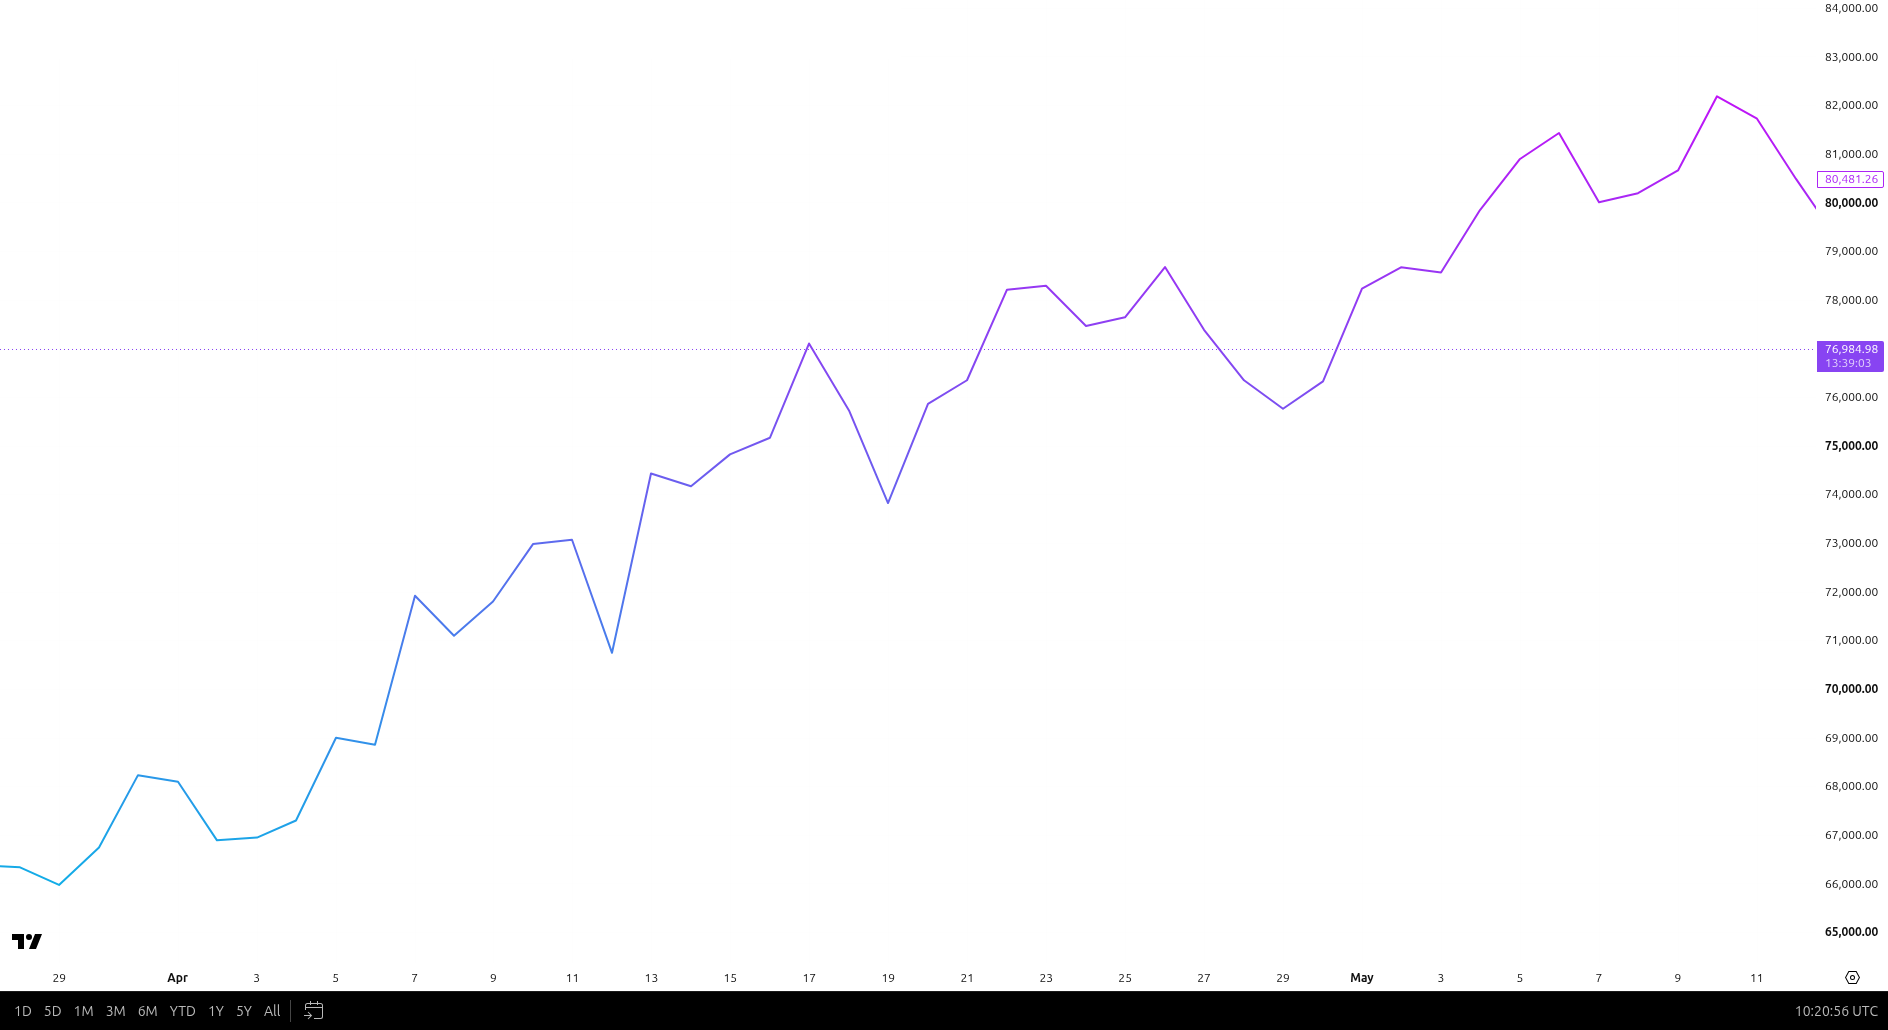
This is the same area as the first chart. The wick that looked like a breakout is gone, because the close never got above the high. If the line didn't break it, the structure didn't break.
How I use it
Wait for the candle to close on the timeframe you trade before calling a break. A daily break needs a daily close. And before you act, plan 3 paths: the break holds, it fails back inside, or price goes sideways. Know your exit for each.
Quick recap
- The wick is a test, the close is the answer.
- Close above the last high = continuation.
- Close below the last higher low = reversal warning.
- Wick through but close back inside = no break, often a fake-out.
- Line charts show only closes, so they hide the noise.
New to the series? Start with Why Price Action Comes First, or see every lesson on the daily lessons page.
We use TradingView for every chart on this site. If you want the same setup, you can try TradingView here (affiliate link, we may earn a small commission at no extra cost to you).
← Previous: Day 12: Market Structure Explained Simply · Next: Day 14 (coming soon)
Not financial advice. This lesson is for education only, and no profits are promised. Always manage your risk.