Markets aren't random. You're just zoomed in too far.
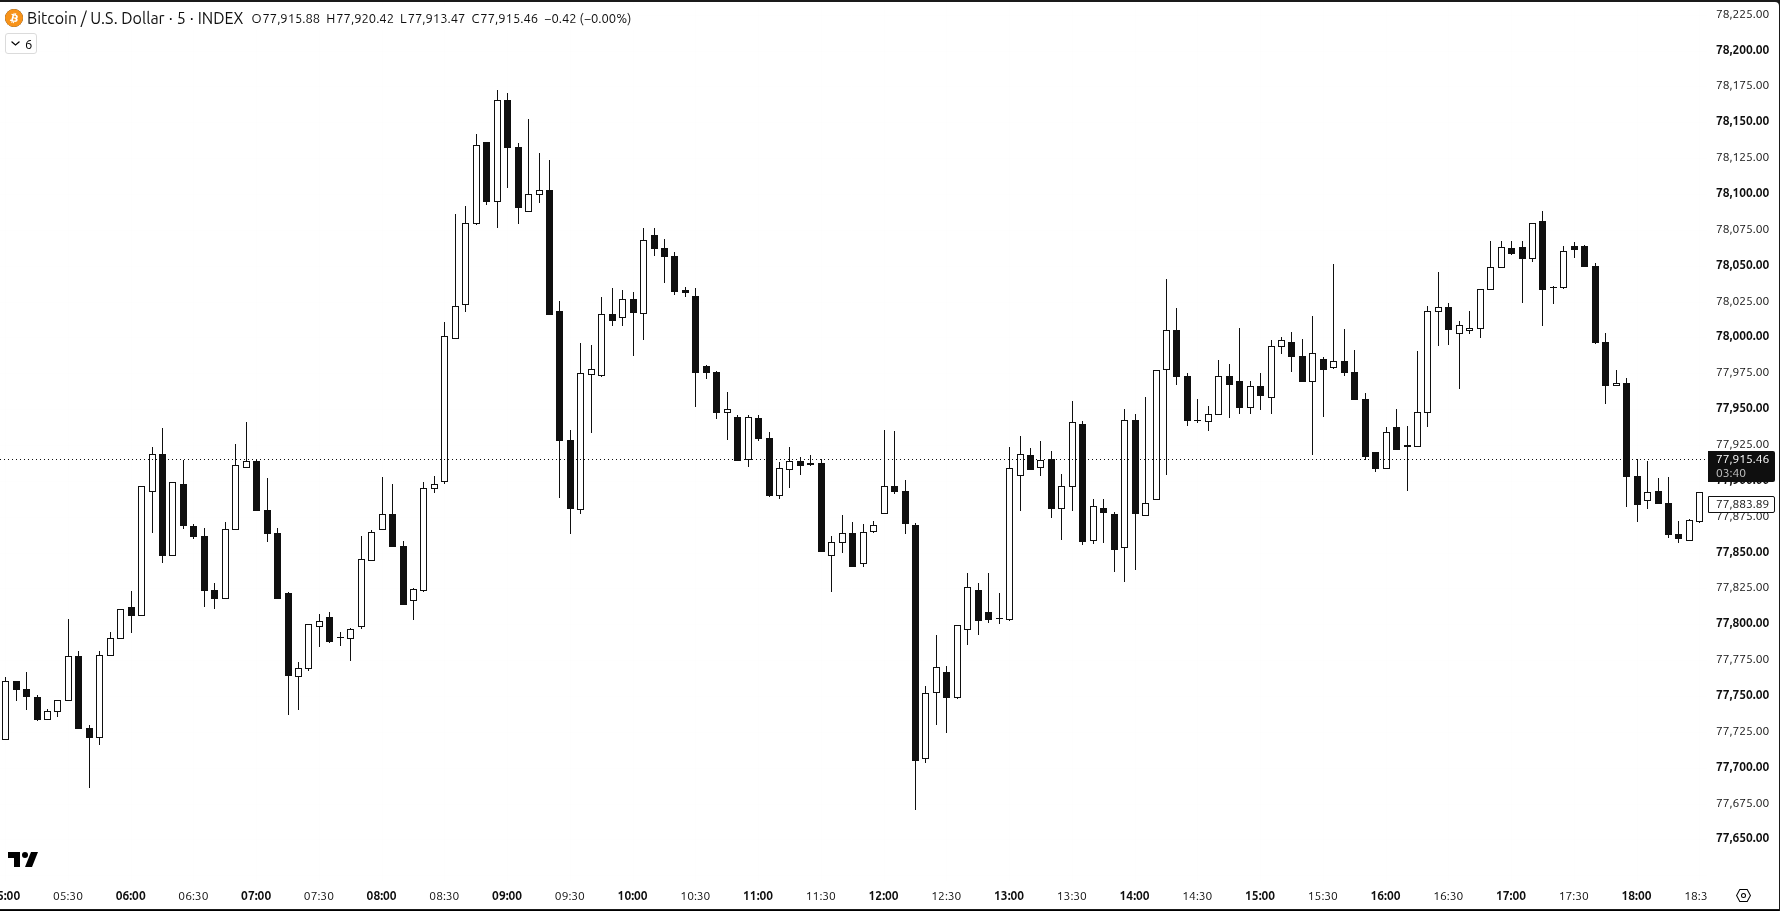
Open a 5-minute chart and price can look like pure noise: up, down, up again, with no direction at all. It's easy to decide the market is random and trading is a coin flip. But zoom out on the same market and a pattern often appears. This lesson is about that pattern, called market structure, and how to read it with nothing more than the highs and lows on your chart.
Why tiny timeframes look random
On very small timeframes, every candle is affected by single orders, quick news headlines and stop runs. That creates a lot of back-and-forth that doesn't mean much. It's like standing with your nose against a painting: you see brush strokes, not the picture.
Step back to the 4-hour or daily chart and those little moves blend together. What looked like chaos turns into clear swings, and the swings show you which way the market is actually leaning.
Here is Bitcoin on the 5-minute chart on 1 November 2026. All day, price chopped inside a small range of about 77,650 to 78,150 with no clear direction.
Uptrend: higher highs and higher lows
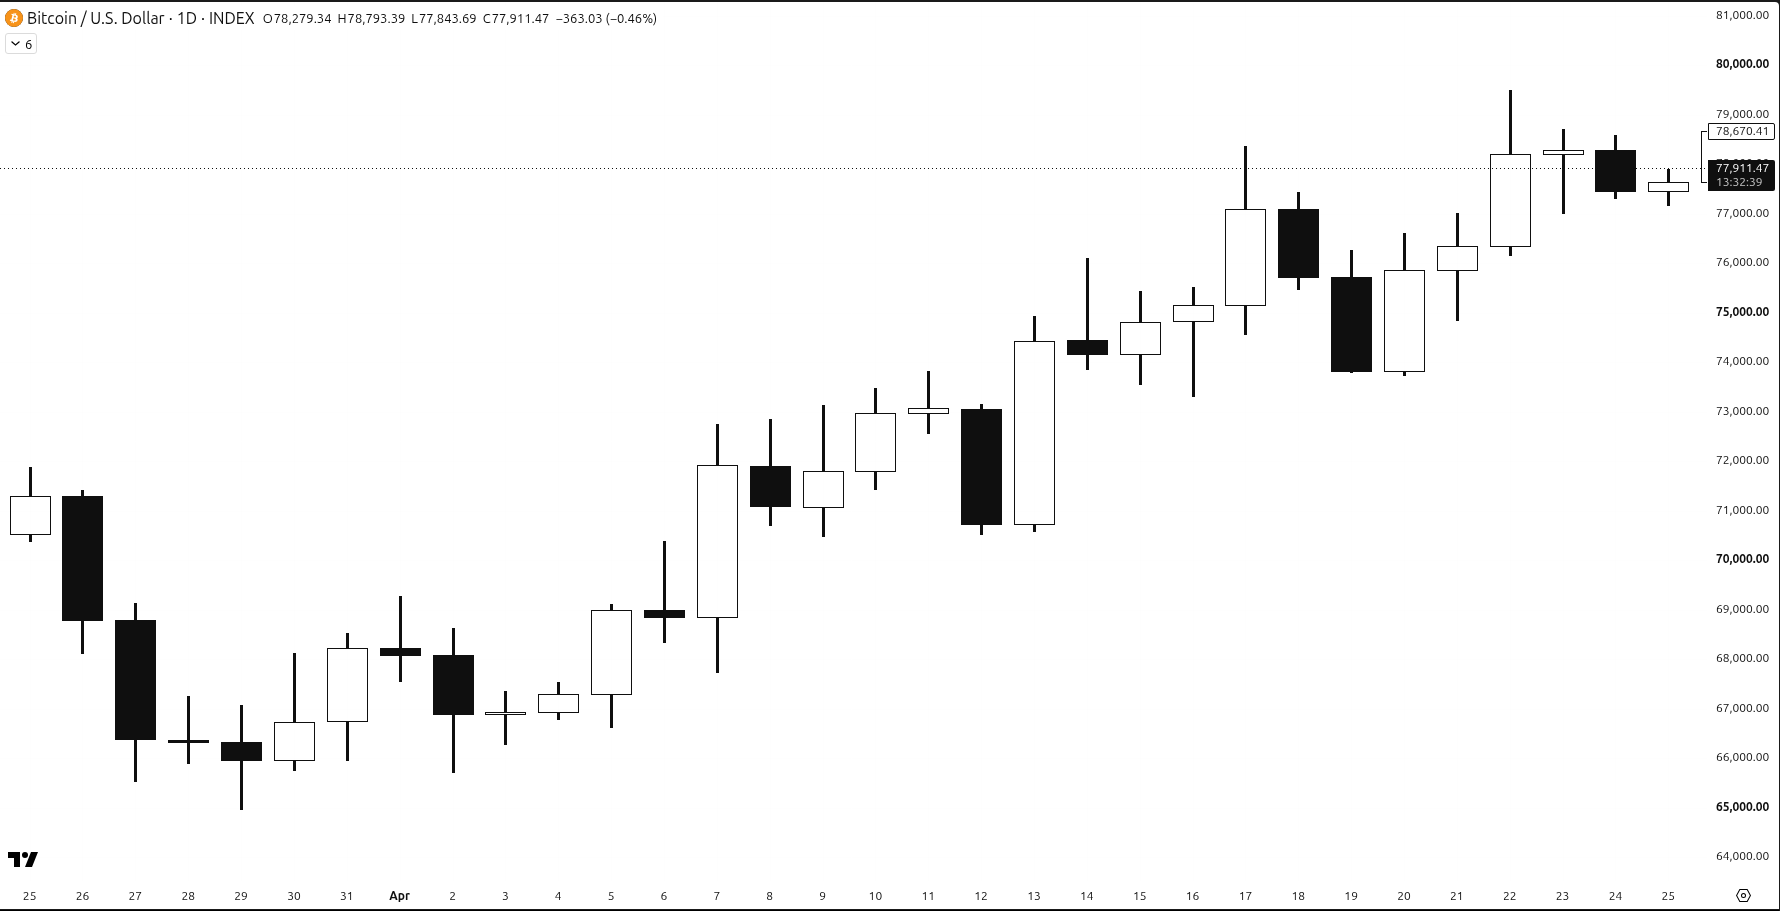
An uptrend is simple to spot once you know what to look for. Each swing high is above the last one (a higher high), and each pullback stops above the last low (a higher low).
- Higher highs show buyers are pushing price further each time.
- Higher lows show buyers are stepping in earlier on every dip.
- As long as both keep happening, the structure says "up".
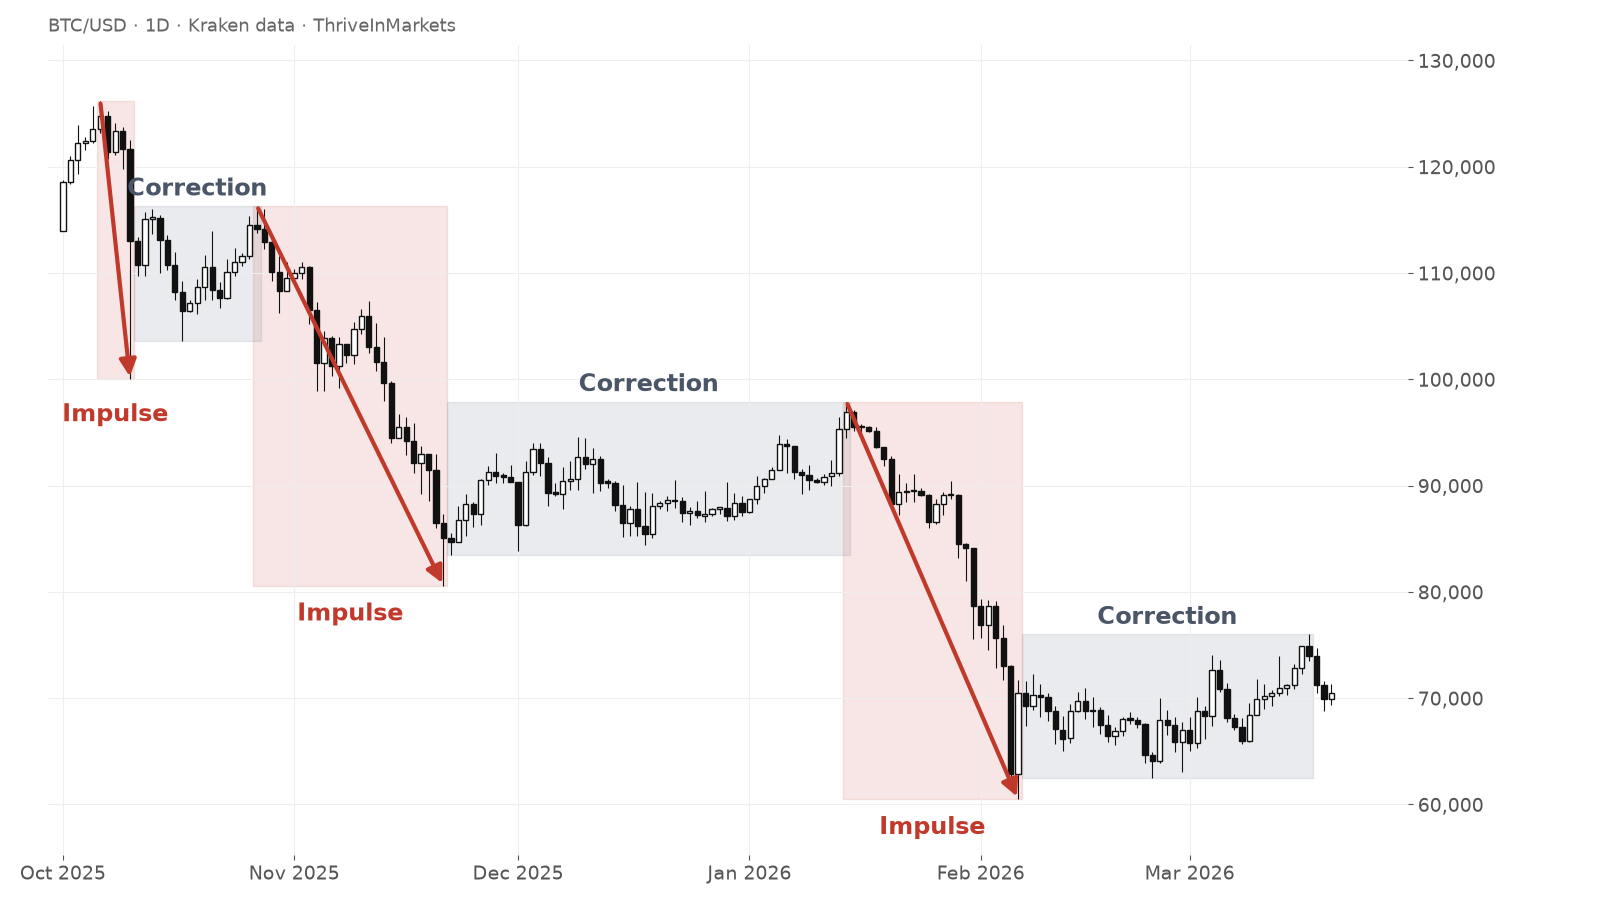
This ties straight back to Day 11: Reading Waves. The fast impulse legs make the higher highs, and the slower corrections make the higher lows.
Here is Bitcoin on the daily chart from late March to late April 2026. The pullbacks kept stopping higher, and each push went to a new high.
Downtrend: lower lows and lower highs
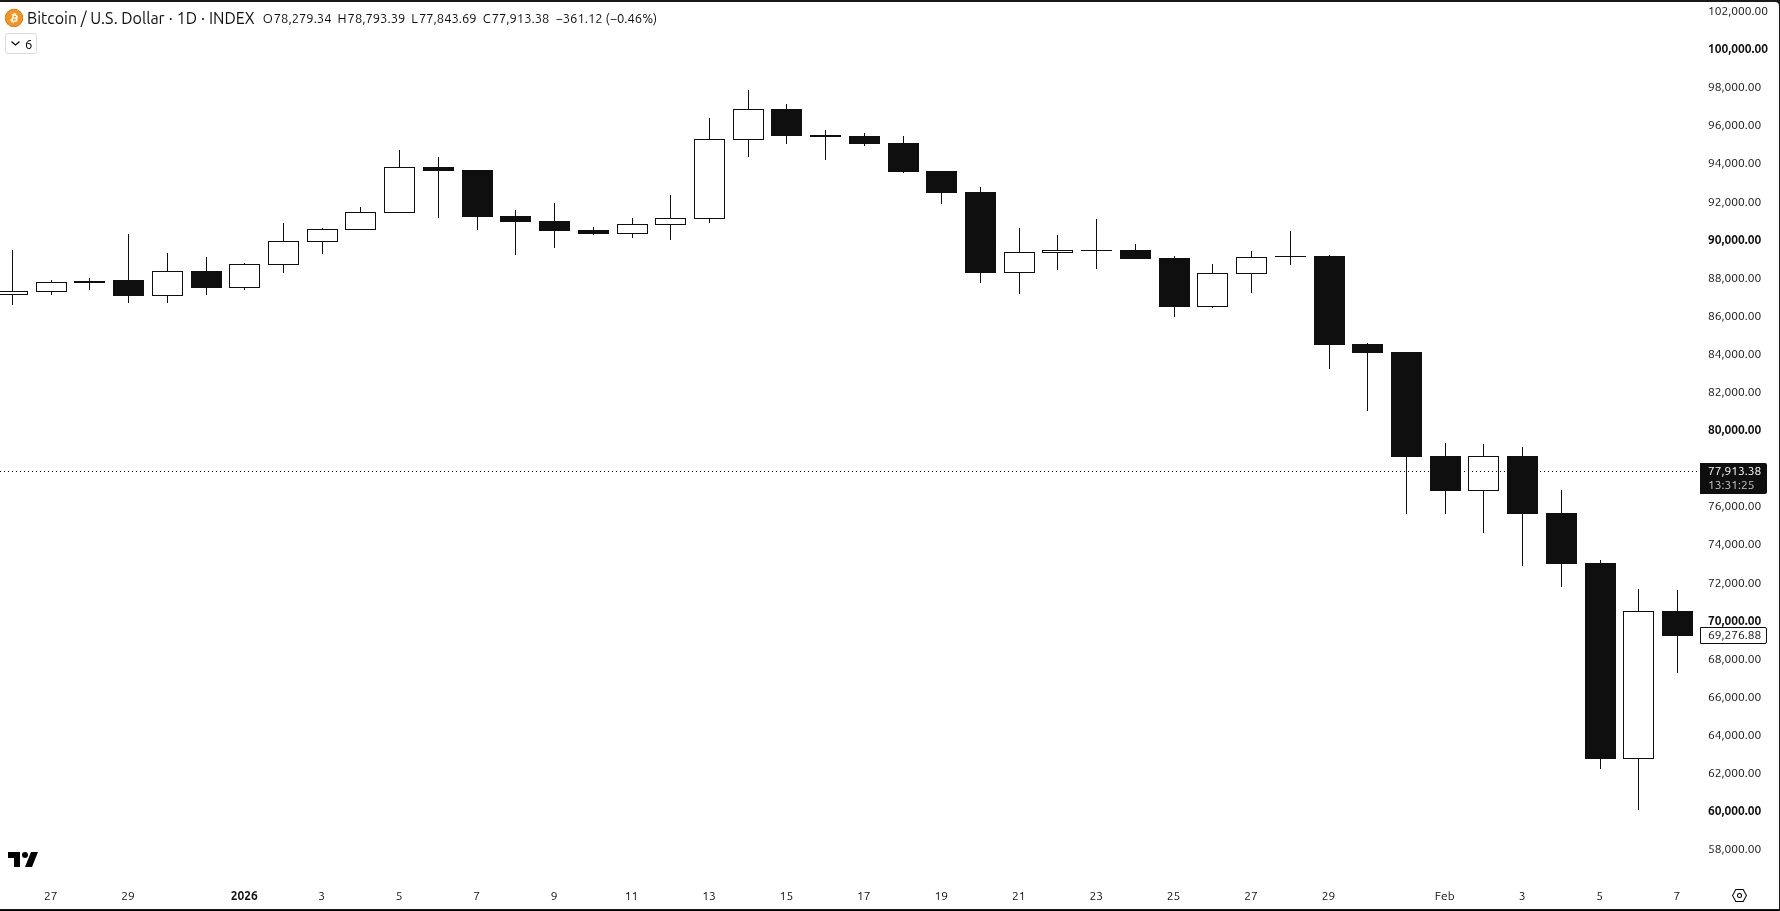
A downtrend is the mirror image. Each drop goes below the last low (a lower low), and each bounce fails below the last high (a lower high).
- Lower lows show sellers are in control.
- Lower highs show buyers give up earlier on every bounce.
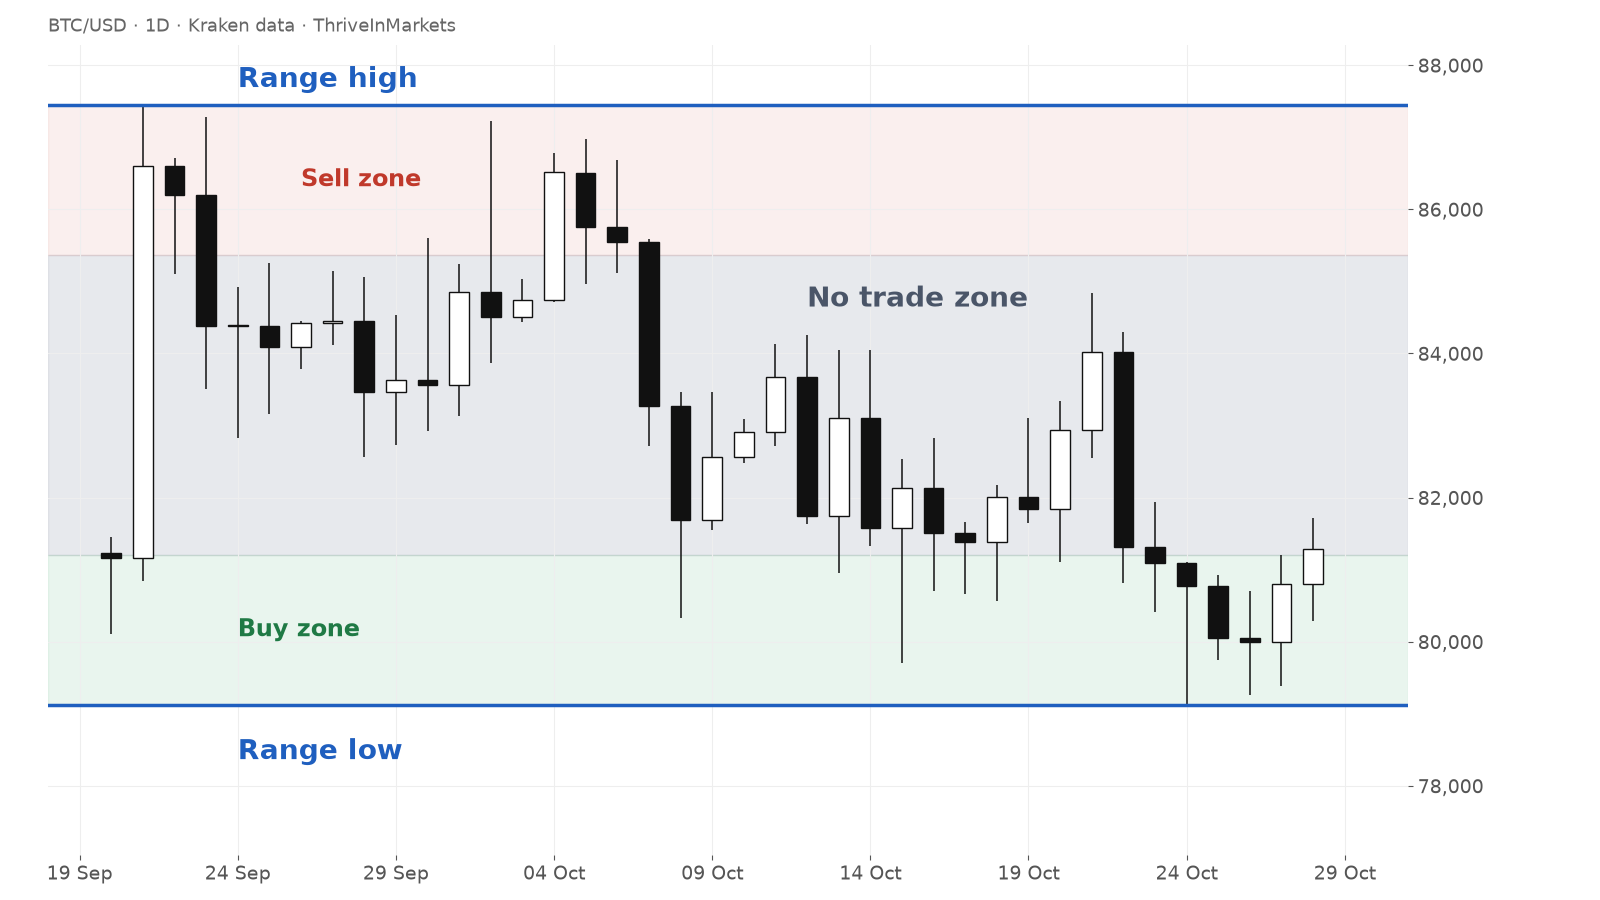
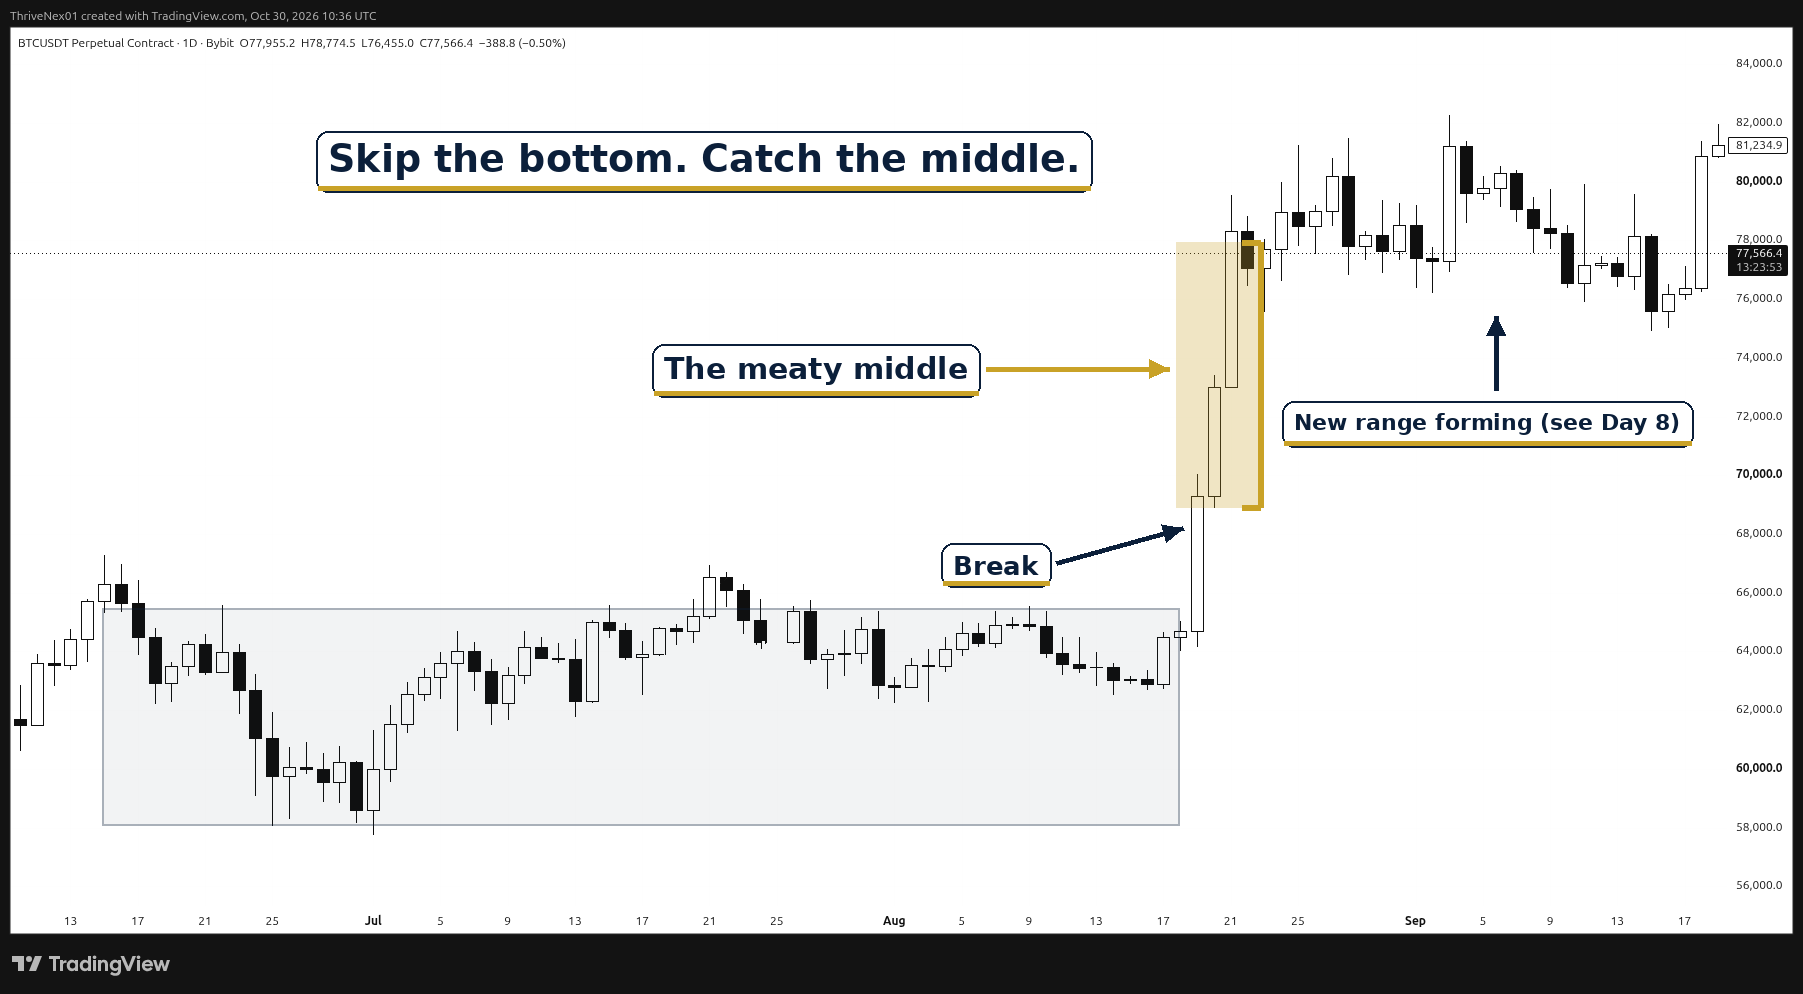
- If price stops making lower lows and starts going sideways, the trend may be pausing in a range, like we covered in Day 8.
Here is Bitcoin on the daily chart from mid-January to early February 2026. Each bounce stopped lower, and each drop went to a new low.
Trends come in three sizes
Here's the part that clears up a lot of confusion. A market can be in more than one trend at the same time, because trends come in sizes:
- The big picture. The main direction on the daily or weekly chart. This is the tide.
- The swings. The moves inside the big picture that last days, usually seen on the 4-hour chart. These are the waves.
- The small wiggles. The minute-to-minute noise inside each swing, on the 5- or 15-minute chart. These are the ripples.
So a daily uptrend can contain a 4-hour swing down, and that swing can contain 5-minute wiggles in both directions. None of them is "wrong". They're just different sizes. Problems start when you trade the ripples while ignoring the tide.
A hypothetical example
Hypothetical numbers, for illustration only. Say a daily chart shows highs at 100, 110 and 120, with pullback lows at 90, 98 and 105. That's higher highs and higher lows: an uptrend. Now price drops from 120 to 112 and the 5-minute chart looks like a crash. Zoomed out, 112 is still above the last higher low at 105, so the daily structure is still up. Only a close below 105 would break that structure and say the picture has changed.
Before you take any trade, plan 3 paths: the structure holds, the structure breaks, or price goes sideways. Know your exit for each.
Quick recap
- Tiny timeframes are full of noise, so they often look random.
- Uptrend = higher highs + higher lows.
- Downtrend = lower lows + lower highs.
- Trends come in three sizes: the big picture, the swings and the small wiggles.
- Check the bigger structure first, then zoom in.
New to the series? Start with Why Price Action Comes First, or see every lesson on the daily lessons page.
We use TradingView for every chart on this site. If you want the same setup, you can try TradingView here (affiliate link, we may earn a small commission at no extra cost to you).
← Previous: Day 11: Reading Waves: Impulse vs Correction · Next: Day 13 (coming soon)
Not financial advice. This lesson is for education only, and no profits are promised. Always manage your risk.